


Similar Questions
Explore conceptually related problems
Recommended Questions
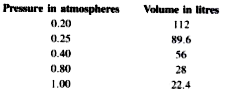
- At constant temperature, the effect of change of pressure on volume of...
Text Solution
|
- At low pressure, the graph of PV vs (1)/(V) for a given amount at a co...
Text Solution
|
- A plot of P vs T for a given mass of gas at constant volume is a strai...
Text Solution
|
- What is the nature of graph of PV versus P for a given mass of a gas a...
Text Solution
|
- What will the nature of PV vs P graph be for a real gas at Boyle tempe...
Text Solution
|
- Why is the PV vs P plot for an ideal gas at a given temperature parall...
Text Solution
|
- for a given mass of an ideal gas at constant temperature draw and expl...
Text Solution
|
- Graph between pressure and volume are plotted at different temperature...
Text Solution
|
- Pressure vs volume graph at constant temperature is known as…………….
Text Solution
|