


Topper's Solved these Questions
Similar Questions
Explore conceptually related problems
ICSE-SOUND-EXERCISE -7(B)
- How does the medium affect the amplitude of the natural vibrations of ...
Text Solution
|
- What are damped vibrations ? How do they differ from free vibrations ?...
Text Solution
|
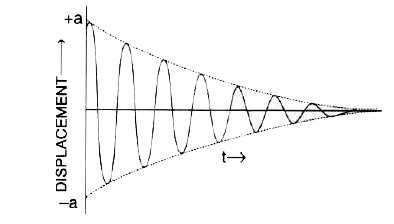
- The diagram in Fig. shows the displacement time graph of a vibrating b...
Text Solution
|
- The diagram in Fig. shows the displacement time graph of a vibrating b...
Text Solution
|
- The diagram in Fig. shows the displacement time graph of a vibrating b...
Text Solution
|
- The diagram in Fig. shows the displacement time graph of a vibrating b...
Text Solution
|
- A tuning fork is vibrating in air. State whether the vibrations are na...
Text Solution
|
- The diagram below shows the displacement-time graph for a vibrating bo...
Text Solution
|
- What are forced vibrations ? Give one example to illustrate your answe...
Text Solution
|
- When the stem of a vibrating tuning fork is gently pressed on the surf...
Text Solution
|
- State two differences between natural and forced vibrations.
Text Solution
|
- What is meant by Resonance ?
Text Solution
|
- State the condition for the resonance to occur.
Text Solution
|
- Complete the following sentence : Resonance is a special case of ........
Text Solution
|
- State two differences between the forced and resonant vibrations.
Text Solution
|
- Why is a loud sound heard at resonance ?
Text Solution
|
- Fig. shows two tuning forks A and B of the same frequency mounted on...
Text Solution
|
- A vibrating tuning fork, held over an air column of a given length wit...
Text Solution
|
- In Fig. , A, B, C and D represent the test tubes each of height 20 cm ...
Text Solution
|
- In Fig. , A, B, C and D represent the test tubes each of height 20 cm ...
Text Solution
|