


Topper's Solved these Questions
Similar Questions
Explore conceptually related problems
ICSE-STATISTICS-EXERCISE 18 (B)
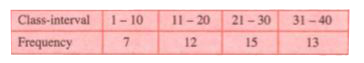
- Draw a histogram for the following data :
Text Solution
|
- Construct a frequency polygon for the following distribution :
Text Solution
|
- Construct a combined histogram and frequency polygon for the following...
Text Solution
|
- Construct a frequency polygon for the following data :
Text Solution
|
- The daily wages in a factory are distributed as follows Draw a f...
Text Solution
|
- Draw frequency polygons for each of the following frequency distributi...
Text Solution
|
- Draw frequency polygons for each of the following frequency distributi...
Text Solution
|