


Topper's Solved these Questions
Similar Questions
Explore conceptually related problems
NCERT TELUGU-DATA HANDLING-Exercise - 4
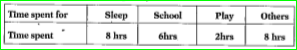
- Draw a pie chart for the following data. Time spent by a child during ...
Text Solution
|
- Draw a bar graph for the following data. Population of India in succ...
Text Solution
|
- Draw a pie chart for the following data.
Text Solution
|
- Draw a double bar graph for the following data. Birth and Death rates ...
Text Solution
|
- Draw a pie chart for the following data. Time spent by a child during ...
Text Solution
|
- The adjoining pie chart gives the expenditure on various items during ...
Text Solution
|
- The adjoining pie chart gives the expenditure on various items during ...
Text Solution
|
- The adjoining pie chart gives the expenditure on various items during ...
Text Solution
|
- The adjoining pie chart gives the expenditure on various Items during ...
Text Solution
|