 .
.


Topper's Solved these Questions
Similar Questions
Explore conceptually related problems
V PUBLICATION-STATISTICS-QUESTION BANK
- The distance covered by an athlete in lóng jump-practice are '6.10,6....
Text Solution
|
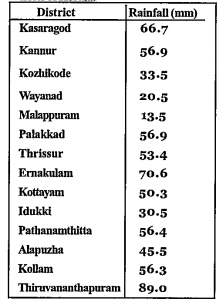
- The table below gives the rainfall during one week of September 2015 i...
Text Solution
|
- Prove that for a set of numbers in arithmetic sequence, the mean and m...
Text Solution
|
- 35 households in a neighbourhood are sorted according to their monthly...
Text Solution
|
- The table shows the workers in a factory sorted according to their dai...
Text Solution
|
- The table below gives the number of babies born in a hospital during a...
Text Solution
|
- The table below shows the employees in an office, sorted according to ...
Text Solution
|
- The table below shows children of a class sorted according to their ma...
Text Solution
|
- The table shows some households sorted according to their usage of ele...
Text Solution
|
- The table below shows children in a class sorted according to their ma...
Text Solution
|
- The table below shows the classification of 100 families in a locality...
Text Solution
|
- The table below classifies 60 students in a class according to their h...
Text Solution
|
- The scores obtained by 50 students in an examination is tabulated as s...
Text Solution
|
- The table helow shows the students of a class sorted,according to thei...
Text Solution
|
- The table below shows workers of a factory sorted according to their w...
Text Solution
|
- Workers of a factory are sorted according to their daily wages. '(##...
Text Solution
|
- Some households in a locality are sorted according to their electricit...
Text Solution
|
- The daily wages of 49 workers of a village are given below. '(##VPUTTT...
Text Solution
|
- The table below shows 60 children in a class sorted according to their...
Text Solution
|
- The table below shows the number of children in a class, sorted accord...
Text Solution
|