A
B
C
D
Text Solution
AI Generated Solution
The correct Answer is:


Similar Questions
Explore conceptually related problems
Recommended Questions
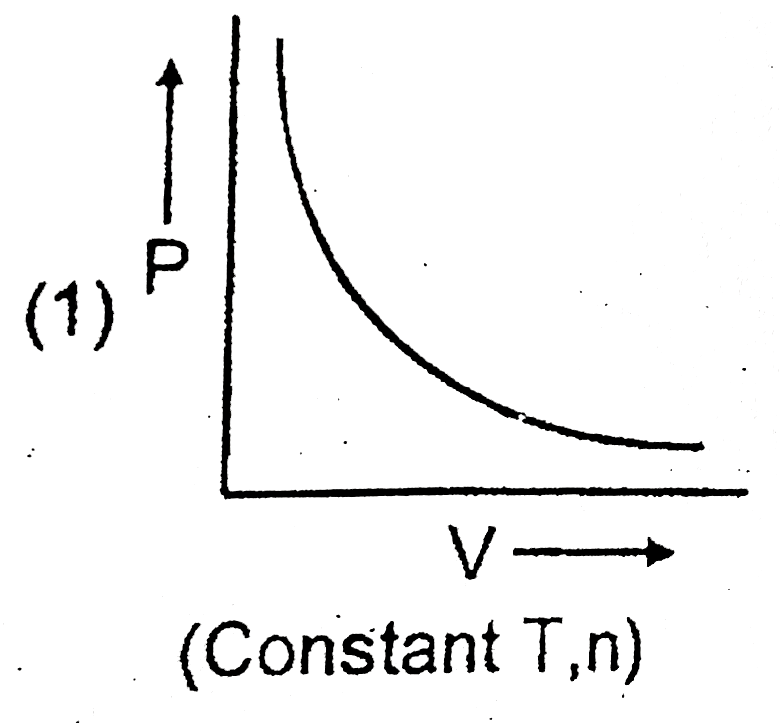
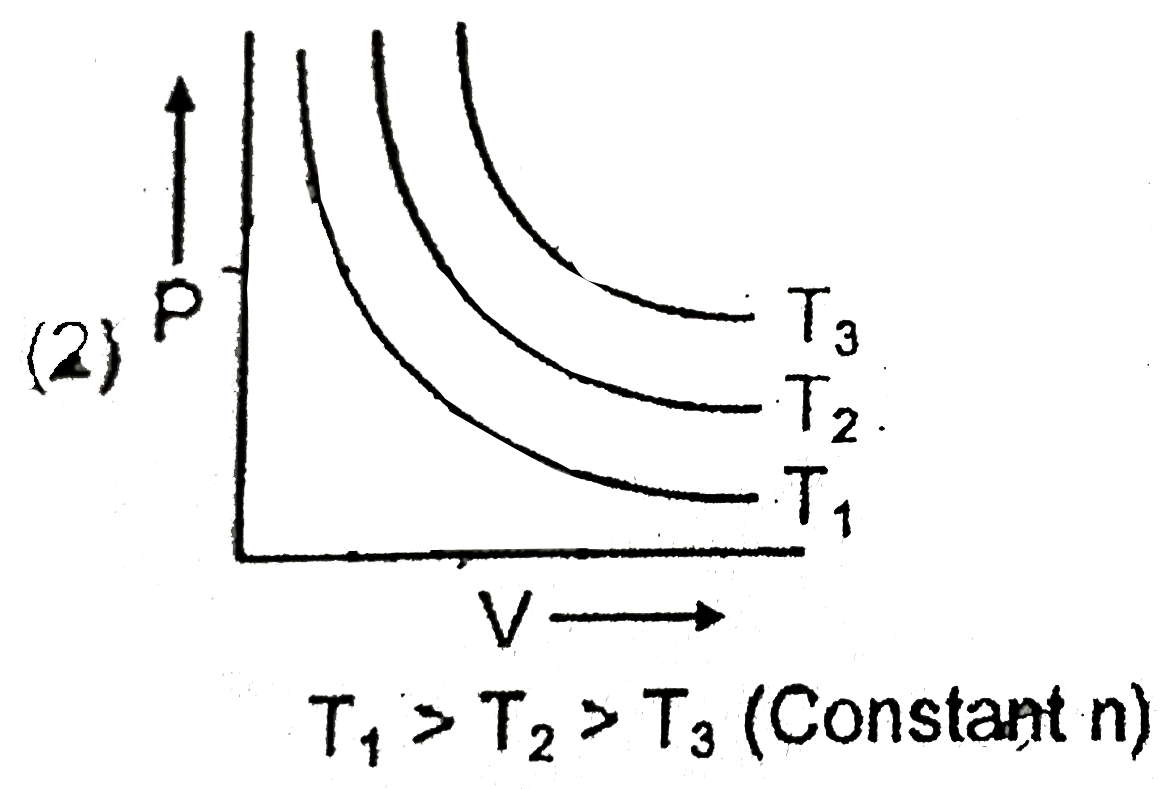
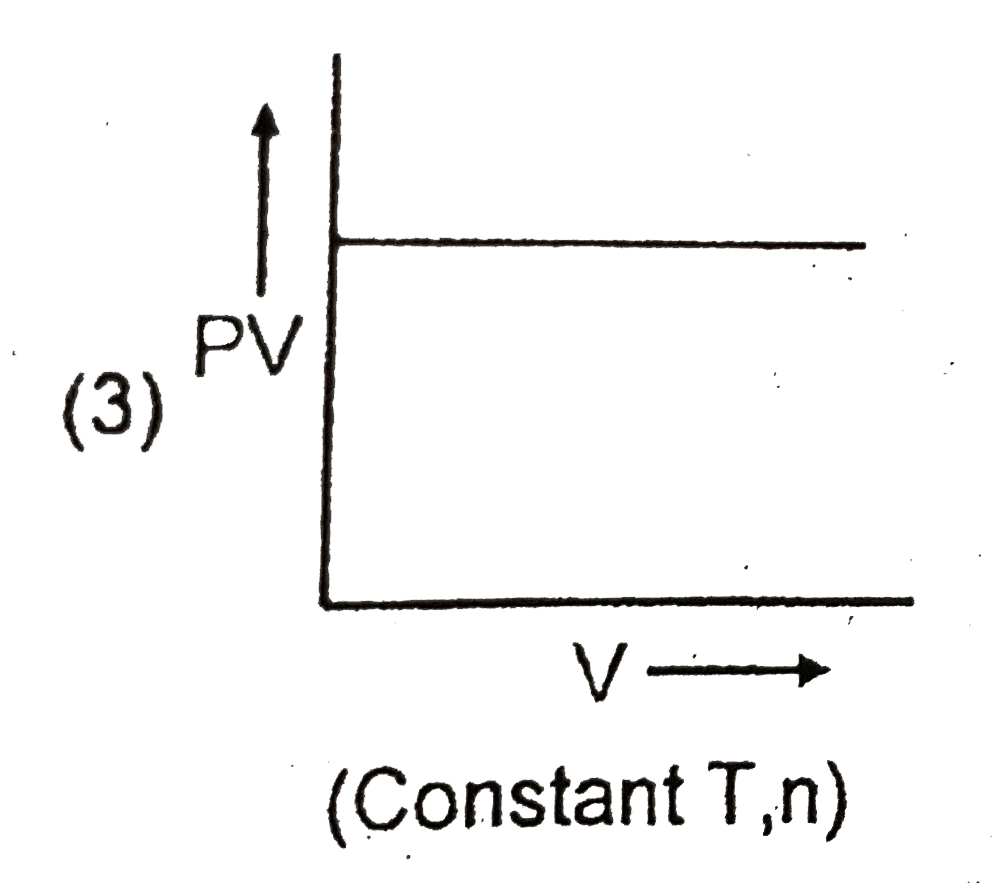
- Which of the following graph ploltted between P and V is INCORRECT ?
Text Solution
|
- Graph between p and V at constant temperature is
Text Solution
|
- Which of the following graph ploltted between P and V is INCORRECT ?
Text Solution
|
- Which of the following graphs is incorrect?
Text Solution
|
- Which of the following is the graph between the frequency (v) of the i...
Text Solution
|
- Which of the following P-V diagram represent the graph of isometric pr...
Text Solution
|
- कौन-सा ग्राफ रेखीय होगा ? P vs. V अथवा P vs. (1)/(V)
Text Solution
|
- Graph between P & V below critical temperature is
Text Solution
|
- Graph between p and V at constant temperature is
Text Solution
|