A
B
C
D
Text Solution
Verified by Experts
The correct Answer is:


Similar Questions
Explore conceptually related problems
Recommended Questions
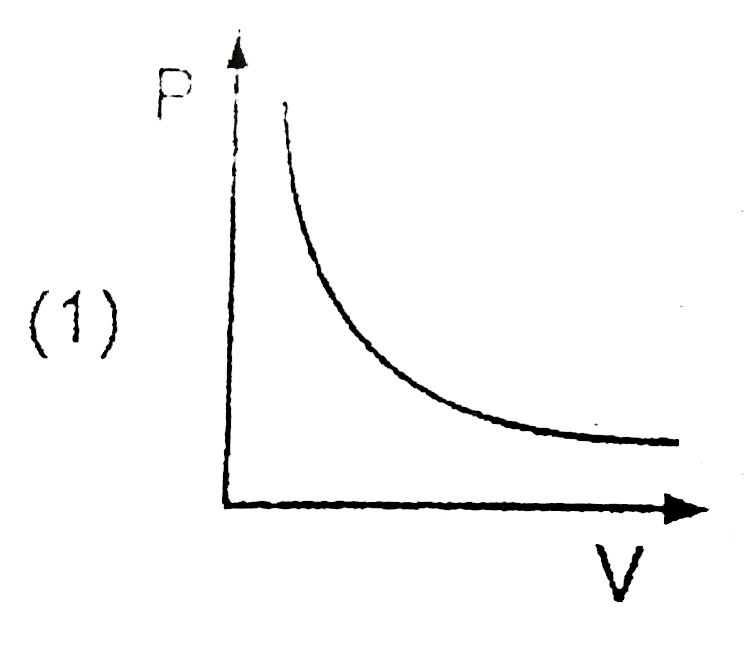
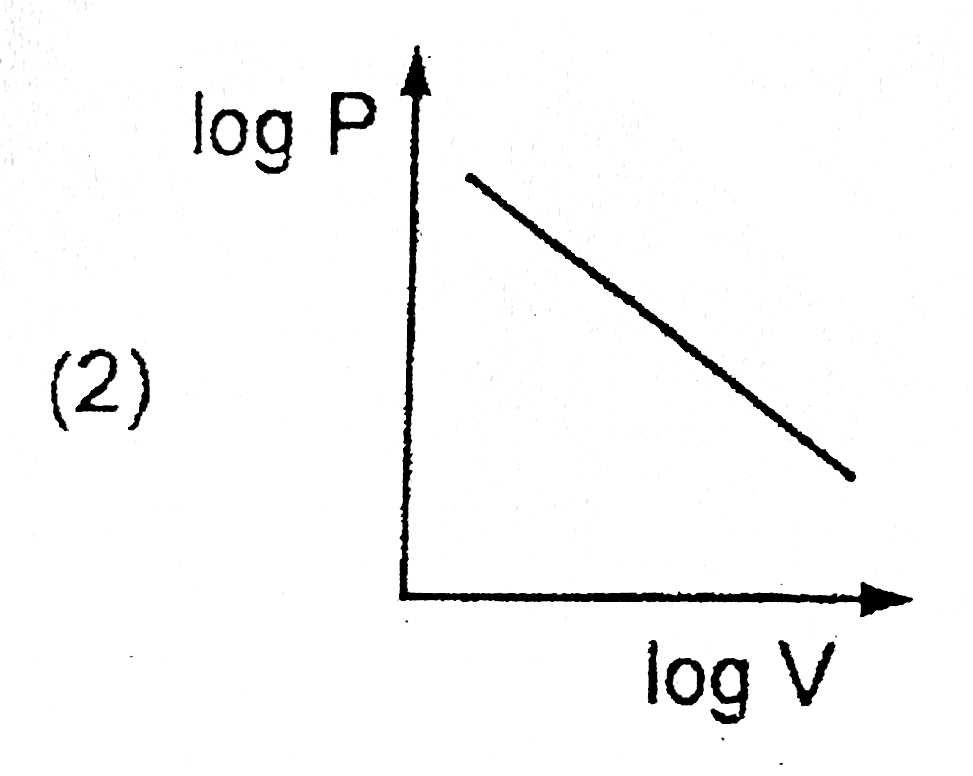
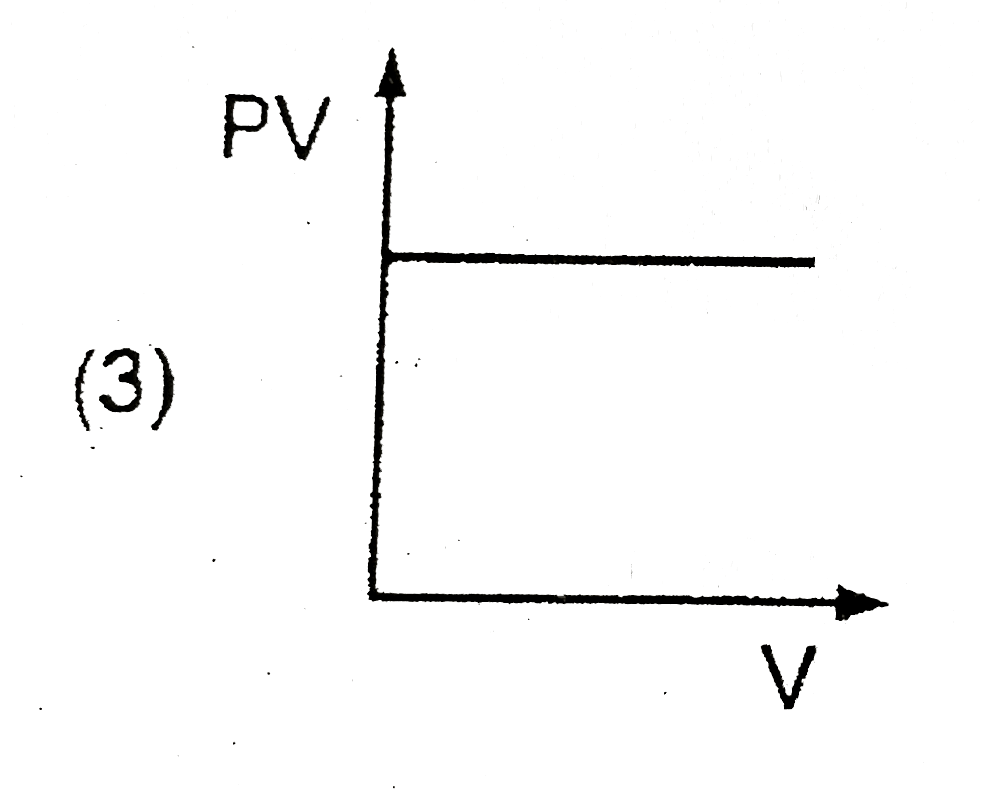
- Which of the following graph represent Boyles law ?
Text Solution
|
- which of the following graphs represents Charles' law correctly ?
Text Solution
|
- Which of the following graph represents Boyle's law ?
Text Solution
|
- Which of the following graph represent Boyle's law ?
Text Solution
|
- यदि कोई गैस बॉयल के नियम का पालन करें तो उसके लिए PV व P के बीच ग्राफ ...
Text Solution
|
- Which of the following graphs represents the correct Boyle's law ?
Text Solution
|
- Which of the following graph represents Boyle's law ?
Text Solution
|
- Which one of the following represents Boyle's temperature of a gas?
Text Solution
|
- கீழ்க்கண்டவற்றுள் பாயில் விதியை சரியாகக் குறிக்கும் படம் எது?
Text Solution
|