 .
.A
B
C
D
Text Solution
Verified by Experts
The correct Answer is:


Topper's Solved these Questions
KTG & THERMODYNAMICS
RESONANCE ENGLISH|Exercise PART -III|25 VideosKTG & THERMODYNAMICS
RESONANCE ENGLISH|Exercise PART -IV|9 VideosKTG & THERMODYNAMICS
RESONANCE ENGLISH|Exercise Exercise-2|1 VideosKINETIC THEORY OF GASES AND THERMODYNAMICS
RESONANCE ENGLISH|Exercise Exercise|64 VideosMAGNETIC FIELD AND FORCES
RESONANCE ENGLISH|Exercise Exercise|64 Videos
Similar Questions
Explore conceptually related problems
RESONANCE ENGLISH-KTG & THERMODYNAMICS-PART -I
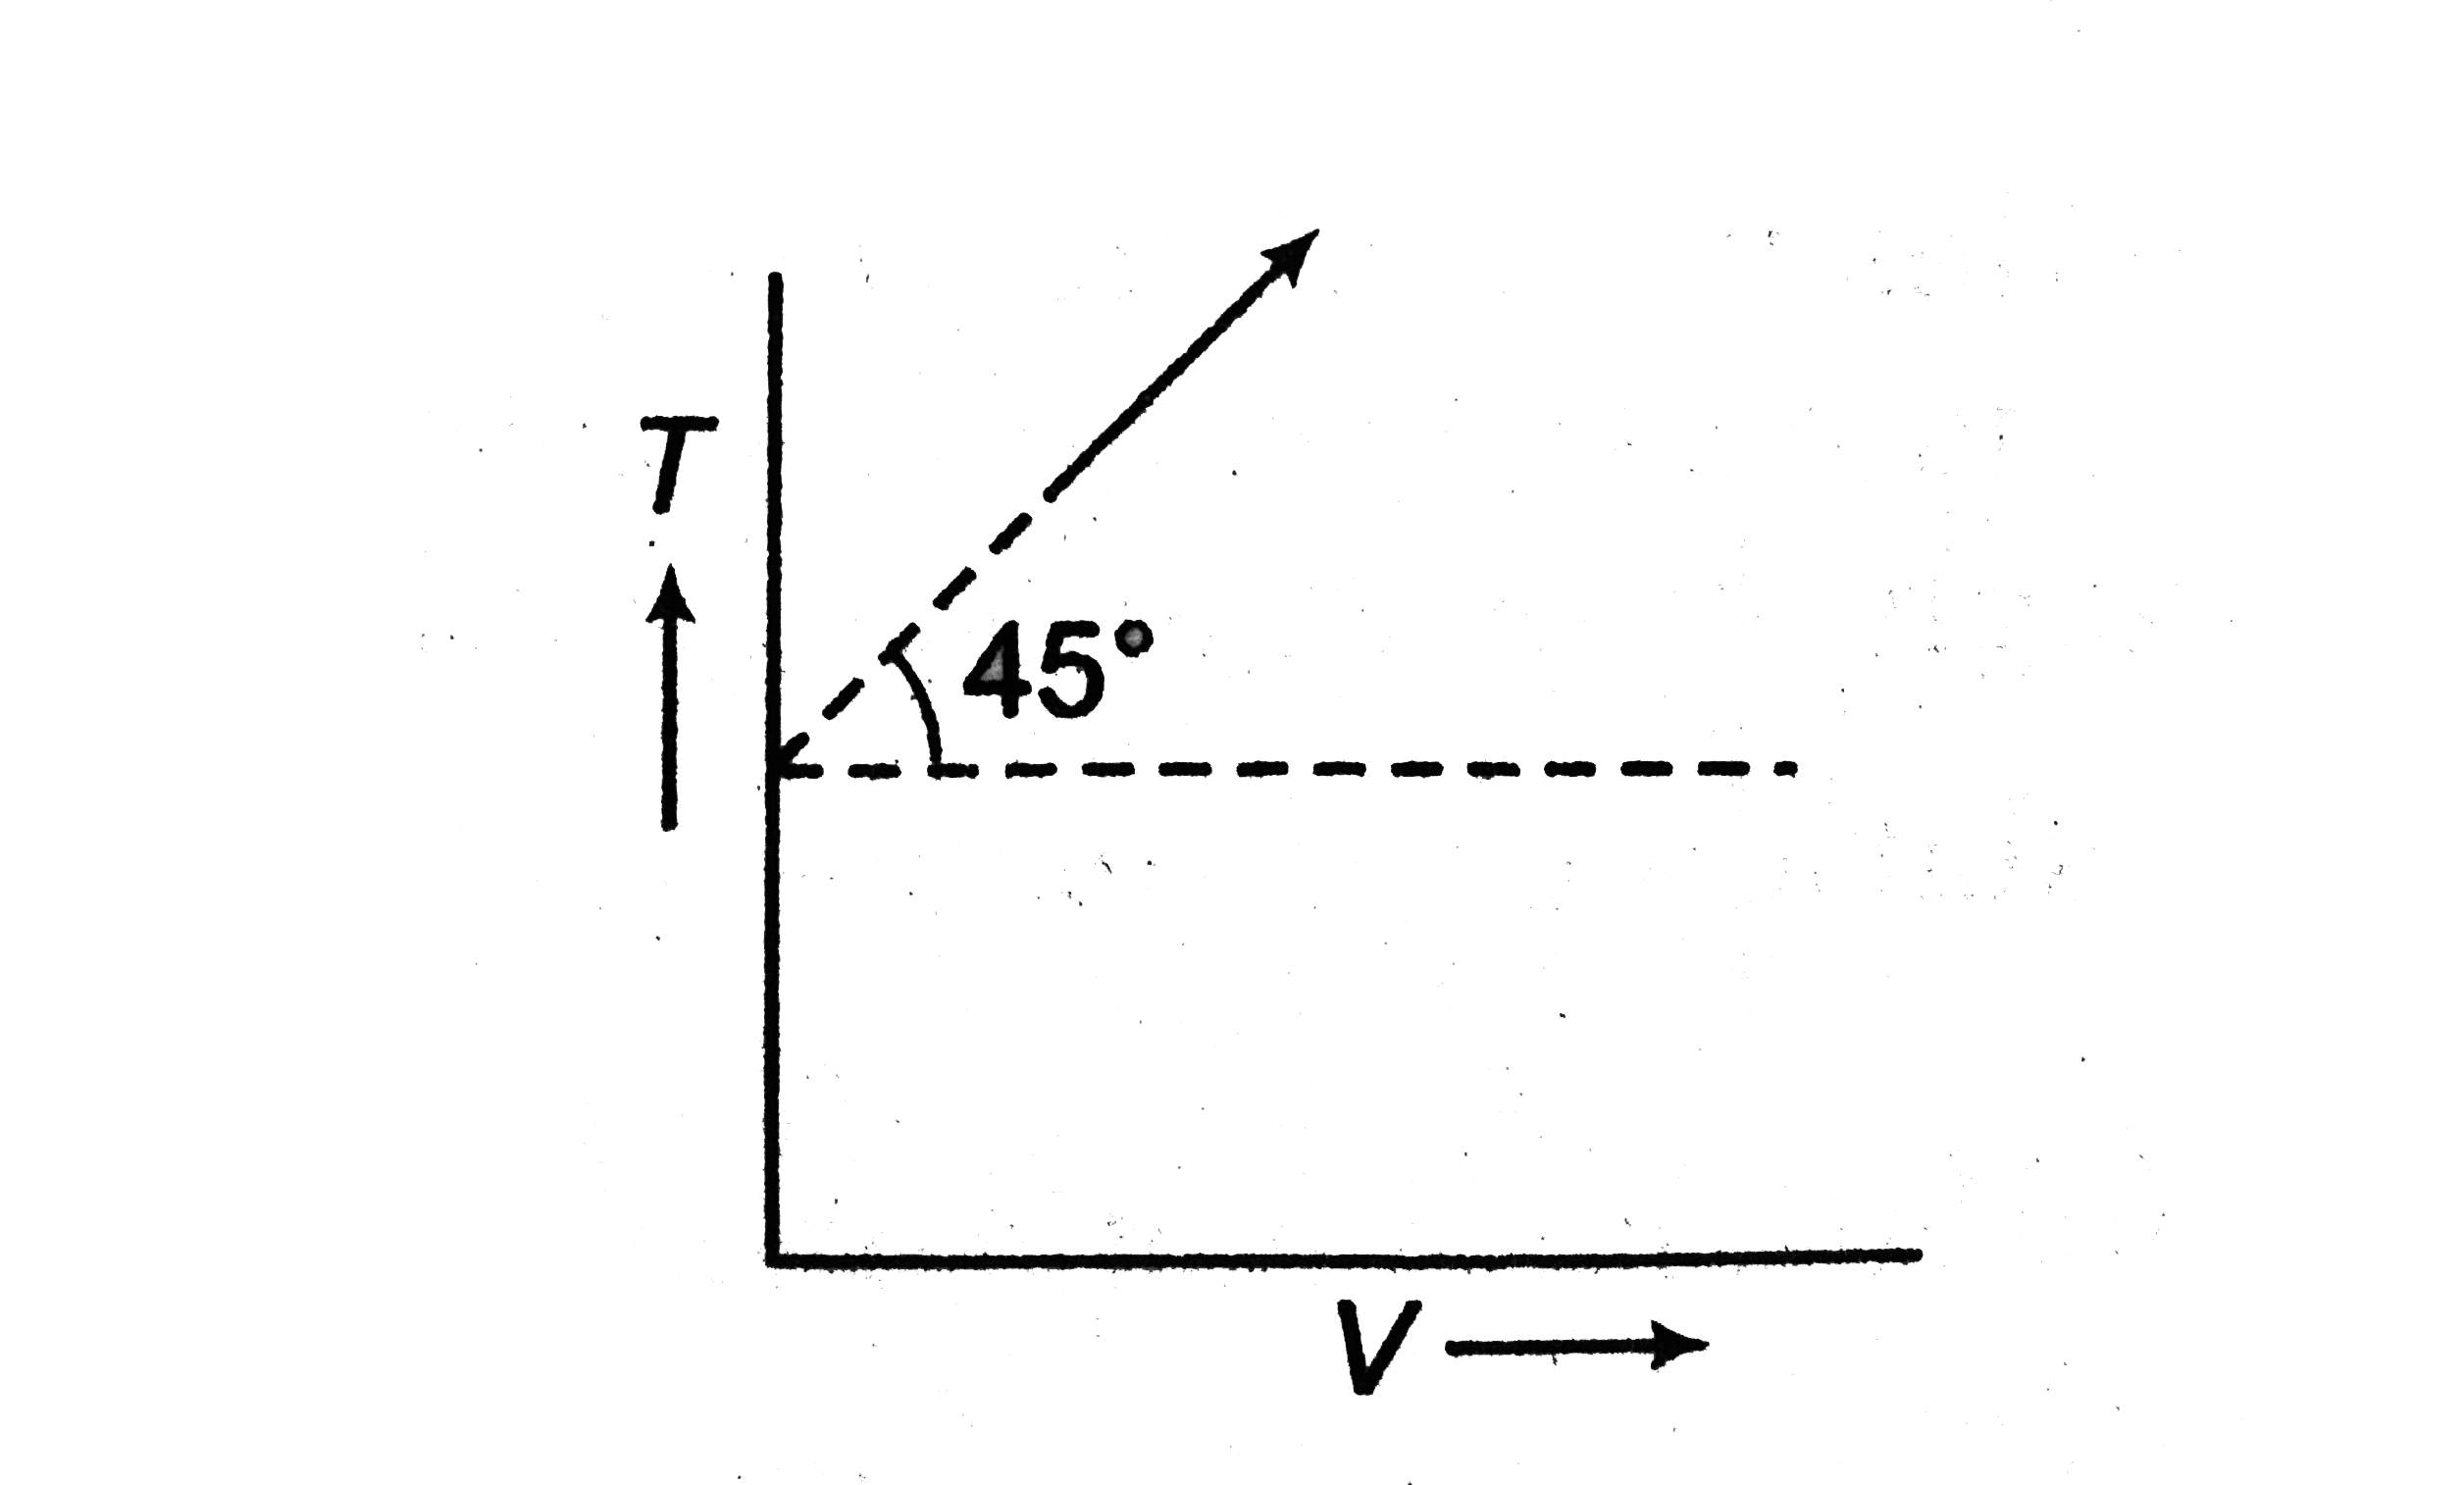
- The given curve represents the variation of temperatue as a function o...
Text Solution
|
- Consider a hypotheticla gas with molecules that can move along only a ...
Text Solution
|
- The value of C(p) - C(v) is 1.09R for a gas sample in state A and is 1...
Text Solution
|
- Find work done by the gas in the process shown in figure.
Text Solution
|
- An ideal monoatomic gas undergoes the process AB as shown in the figur...
Text Solution
|
- An ideal monoatomic gas is initially in state 1 with pressure p(1) = 2...
Text Solution
|
- For two thermodynamic process temperature and volume diagram are given...
Text Solution
|
- Curve in the figure shows an adiabatic compression of an ideal gas fro...
Text Solution
|
- P(i), V(i)are initial pressure and volumes and V(f) is final volume of...
Text Solution
|
- A cylinder containing an ideal gas ( see figure ) and closed by a mova...
Text Solution
|
- Two different ideal diatomic gases A and B are initially in the same s...
Text Solution
|
- If ideal diatomic gas follows the process, as shown in graph, where T ...
Text Solution
|
- A mono-atomic ideal gas is compressed form volume V to V//2 through va...
Text Solution
|
- 4 moles of H(2) at 500K is mixed with 2 moles of He at 400k. The mixtu...
Text Solution
|
- In a process the pressure of a gas is inversely proportional to the sq...
Text Solution
|