A
B
C
D
Text Solution
Verified by Experts
The correct Answer is:


Topper's Solved these Questions
DAILY PRACTICE PROBLEMS
RESONANCE ENGLISH|Exercise Compreshension|6 VideosDAILY PRACTICE PROBLEMS
RESONANCE ENGLISH|Exercise Dpp no 12 Physics|8 VideosDAILY PRACTICE PROBLEMS
RESONANCE ENGLISH|Exercise Dpp no 10 physics|8 VideosCURRENT ELECTRICITY
RESONANCE ENGLISH|Exercise Exercise|53 VideosELASTICITY AND VISCOCITY
RESONANCE ENGLISH|Exercise Advanced Level Problems|9 Videos
Similar Questions
Explore conceptually related problems
RESONANCE ENGLISH-DAILY PRACTICE PROBLEMS-Dpp no 11 physics
- A bal is thrown vertically upwards from the ground. It crosses a point...
Text Solution
|
- The distance travelled by a freely falling body is proportional to
Text Solution
|
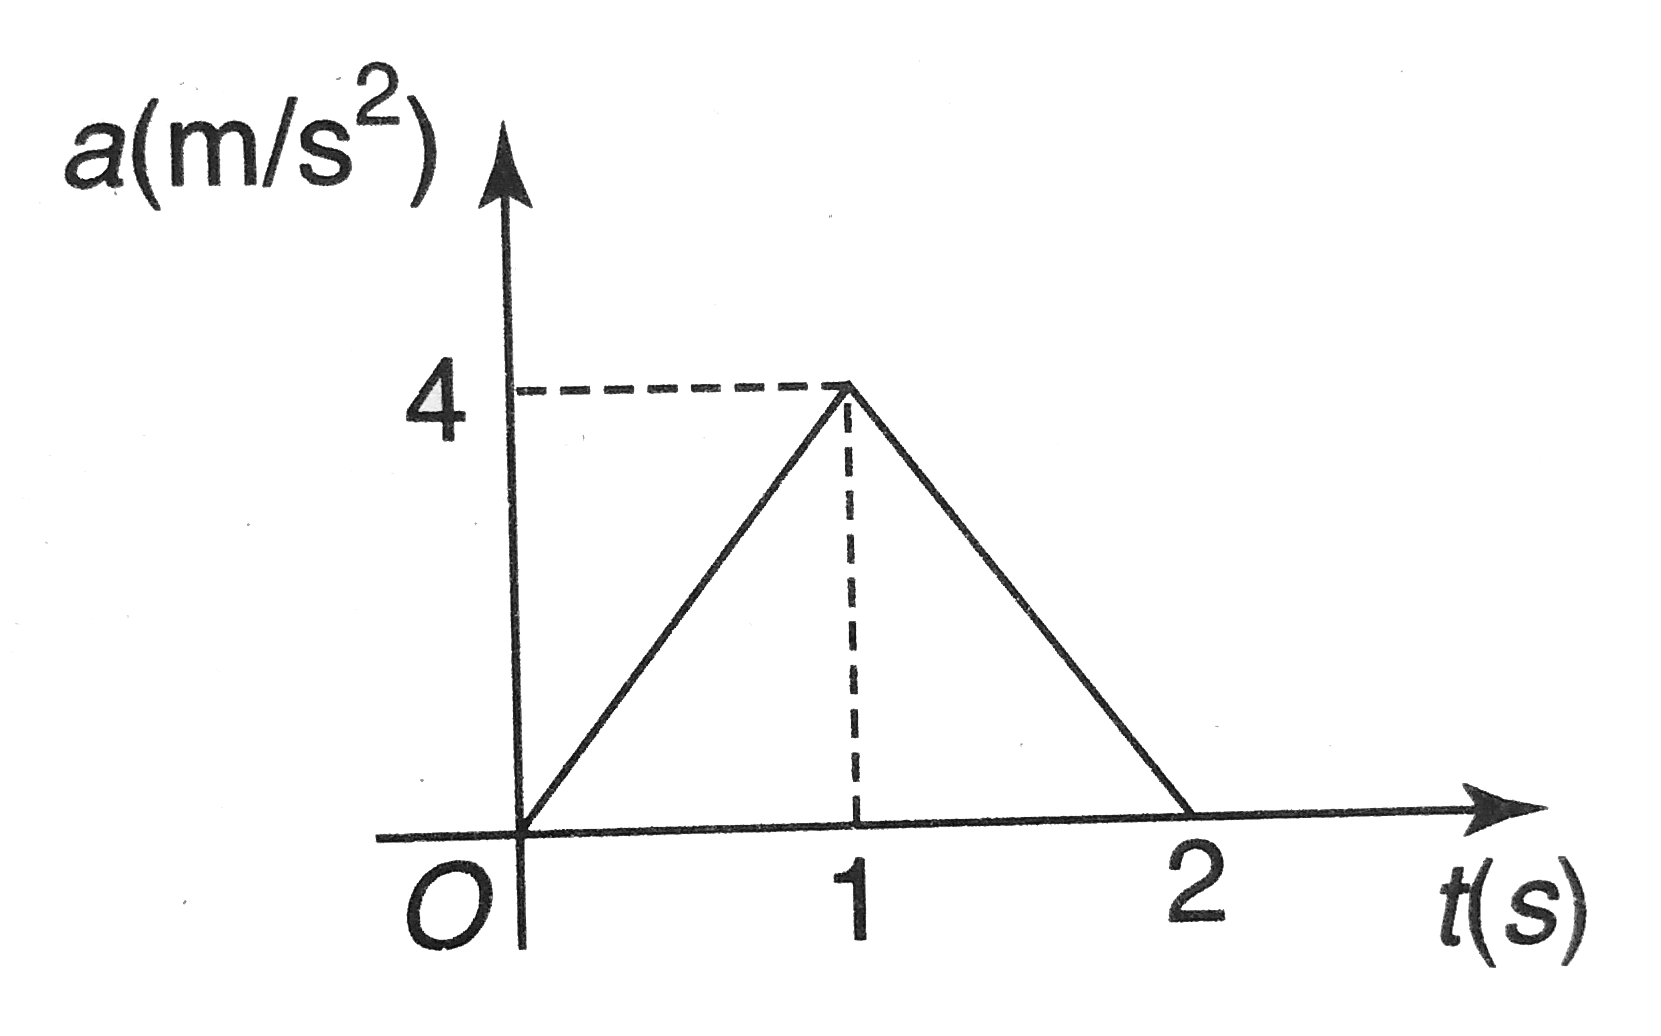
- The acceleration-time graph of a particle moving in a straight line is...
Text Solution
|
- A parachutist drops first freely from a plane for 10 s and then his p...
Text Solution
|
- The displacement of a body is given to be proportional to the cube of ...
Text Solution
|
- A ball is thrown vertically up with a certain velocity. It attains a h...
Text Solution
|