Home
Class 11
PHYSICS
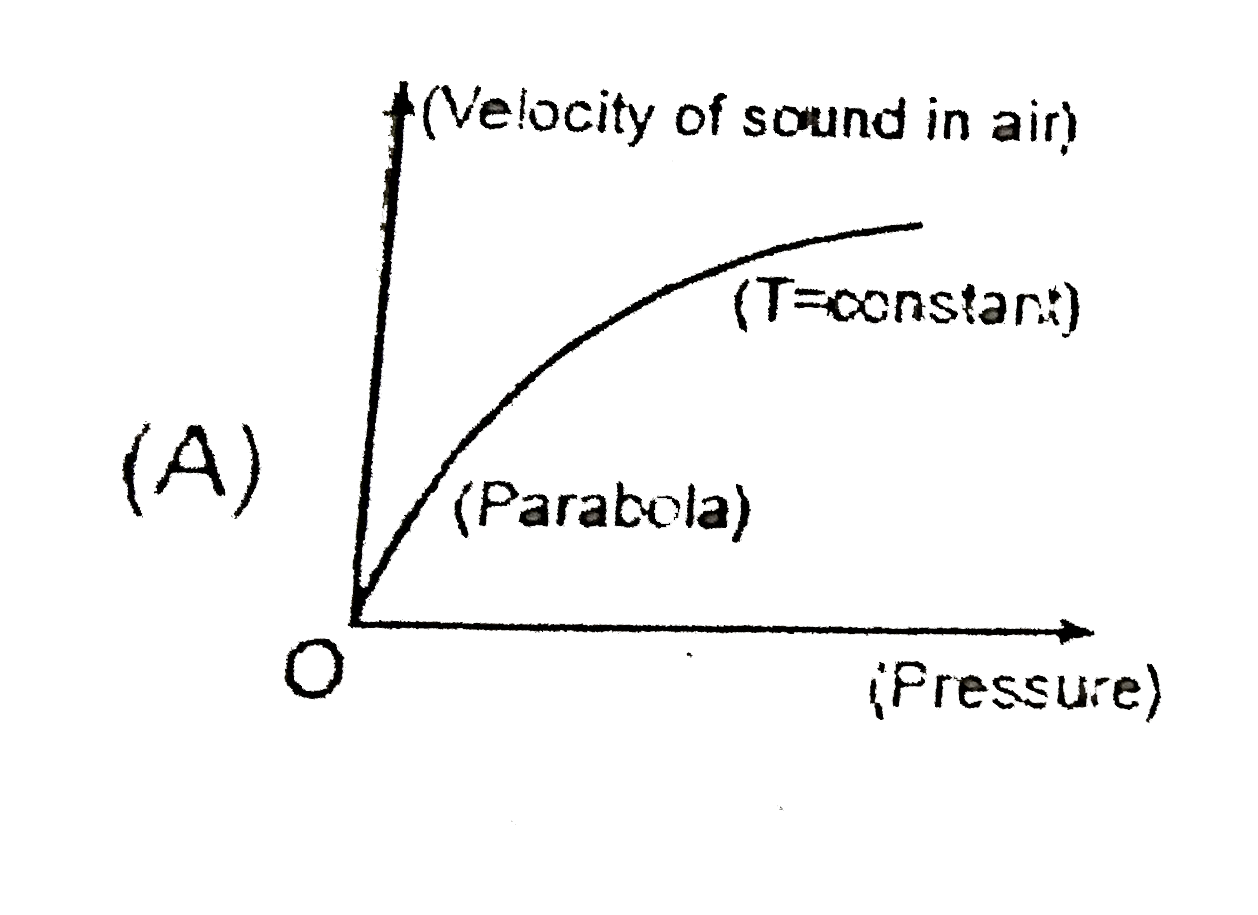
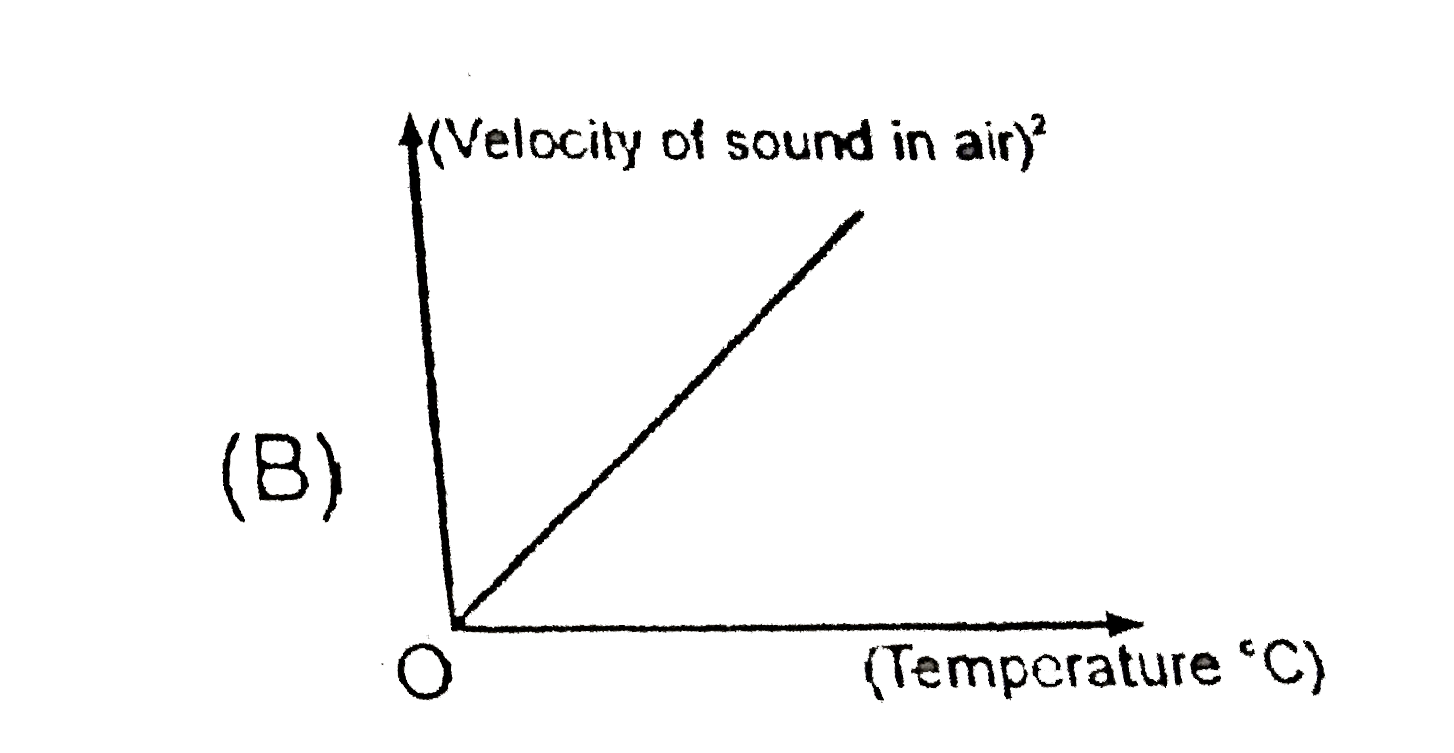
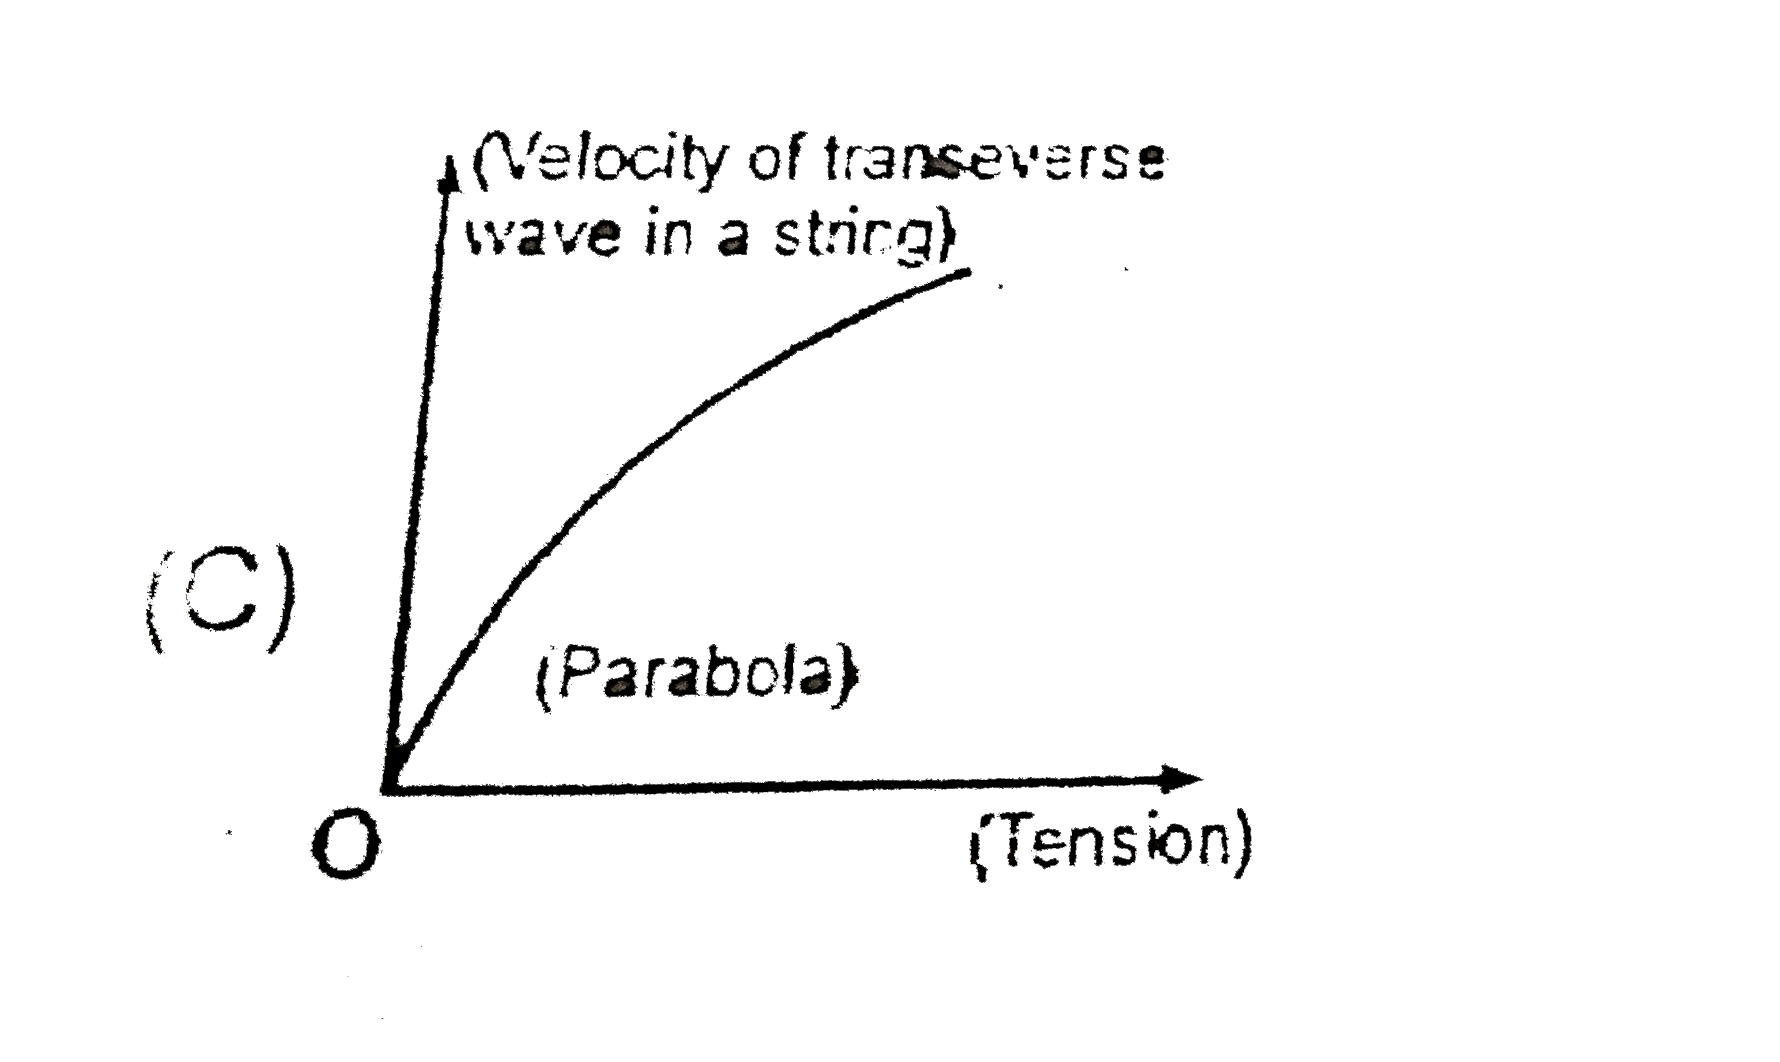
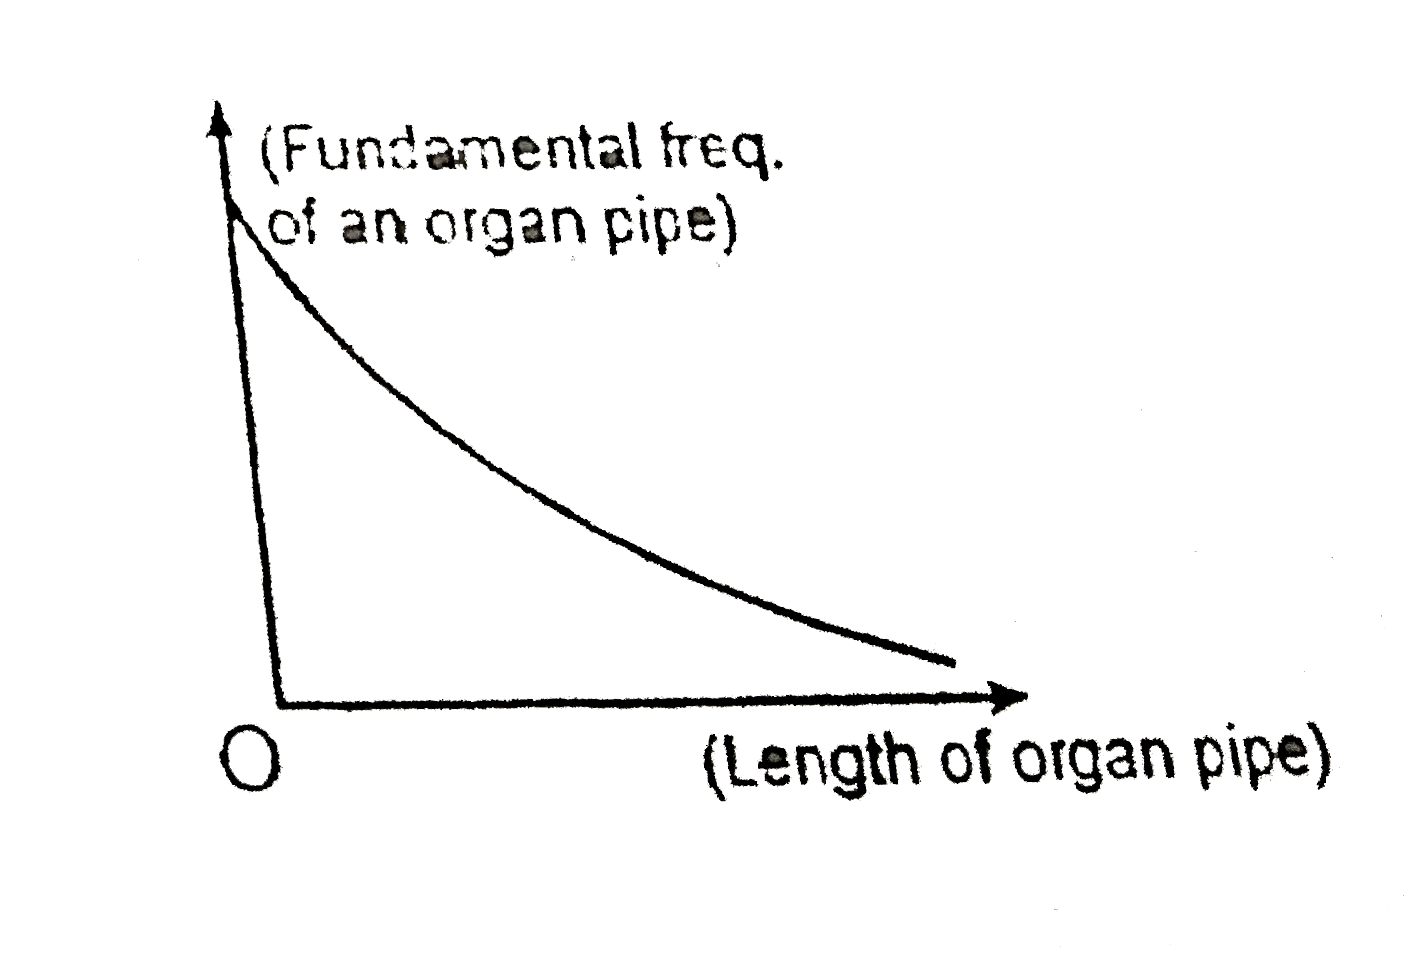
Which of the following is // are correct...

Which of the following is `//` are correct .

A

B

C

D

Text Solution

AI Generated Solution

The correct Answer is:
To determine which of the statements regarding the graphs is correct, we will analyze each option based on the principles of sound velocity, temperature dependence, and the characteristics of organ pipes. ### Step-by-Step Solution: 1. **Understanding the Velocity of Sound in Air**: - The velocity of sound in air is independent of pressure. This means that changes in atmospheric pressure do not affect the speed of sound in air. **Hint**: Remember that sound travels through air, and its speed is primarily influenced by temperature rather than pressure. 2. **Temperature Dependence**: - The velocity of sound in air is proportional to the square root of the absolute temperature (T). This can be expressed mathematically as: \[ v \propto \sqrt{T} \] - Therefore, if we were to graph velocity (v) against temperature (T), we would expect a parabolic relationship. **Hint**: Think about how squaring a relationship affects the graph shape; a square root relationship creates a curve. 3. **Analyzing the Graphs**: - **Graph A and B**: Since the velocity of sound is independent of pressure and proportional to the square root of temperature, any graphs that suggest a direct relationship with pressure or a linear relationship with temperature are incorrect. - **Graph C**: This graph is expected to show a parabolic relationship between velocity and temperature, which aligns with our understanding of the temperature dependence of sound velocity. - **Graph D**: The fundamental frequency of an organ pipe can be expressed as: \[ f_0 = \frac{v}{2L} \] where \(f_0\) is the fundamental frequency, \(v\) is the velocity of sound, and \(L\) is the length of the pipe. This relationship indicates that as the length of the pipe increases, the frequency decreases, which results in a hyperbolic graph when plotting frequency against length. **Hint**: Recall the relationship between frequency and wavelength in organ pipes; longer pipes produce lower frequencies. 4. **Conclusion**: - Based on the analysis: - Graphs A and B are incorrect. - Graph C correctly represents the parabolic relationship between velocity and temperature. - Graph D correctly represents the hyperbolic relationship between frequency and length of the organ pipe. - Therefore, the correct statements are those represented by Graph C and Graph D. ### Final Answer: - The correct graphs are C and D.

To determine which of the statements regarding the graphs is correct, we will analyze each option based on the principles of sound velocity, temperature dependence, and the characteristics of organ pipes. ### Step-by-Step Solution: 1. **Understanding the Velocity of Sound in Air**: - The velocity of sound in air is independent of pressure. This means that changes in atmospheric pressure do not affect the speed of sound in air. **Hint**: Remember that sound travels through air, and its speed is primarily influenced by temperature rather than pressure. ...
Promotional Banner

Topper's Solved these Questions

  • DAILY PRACTICE PROBLEMS

    RESONANCE ENGLISH|Exercise Now answer the following :|20 Videos
  • DAILY PRACTICE PROBLEMS

    RESONANCE ENGLISH|Exercise dpp 89 illustration|5 Videos
  • DAILY PRACTICE PROBLEMS

    RESONANCE ENGLISH|Exercise dpp 87|6 Videos
  • CURRENT ELECTRICITY

    RESONANCE ENGLISH|Exercise Exercise|53 Videos
  • ELASTICITY AND VISCOCITY

    RESONANCE ENGLISH|Exercise Advanced Level Problems|9 Videos