 .
.A
B
C
D
Text Solution
Verified by Experts
The correct Answer is:


Topper's Solved these Questions
DAILY PRACTICE PROBLEM
RESONANCE ENGLISH|Exercise DPP No.22|9 VideosDAILY PRACTICE PROBLEM
RESONANCE ENGLISH|Exercise DPP No.23|20 VideosDAILY PRACTICE PROBLEM
RESONANCE ENGLISH|Exercise DPP No.20|9 VideosCURRENT ELECTRICITY
RESONANCE ENGLISH|Exercise High Level Problems (HIP)|19 VideosELECTRO MAGNETIC WAVES
RESONANCE ENGLISH|Exercise Exercise 3|27 Videos
RESONANCE ENGLISH-DAILY PRACTICE PROBLEM-DPP No.21
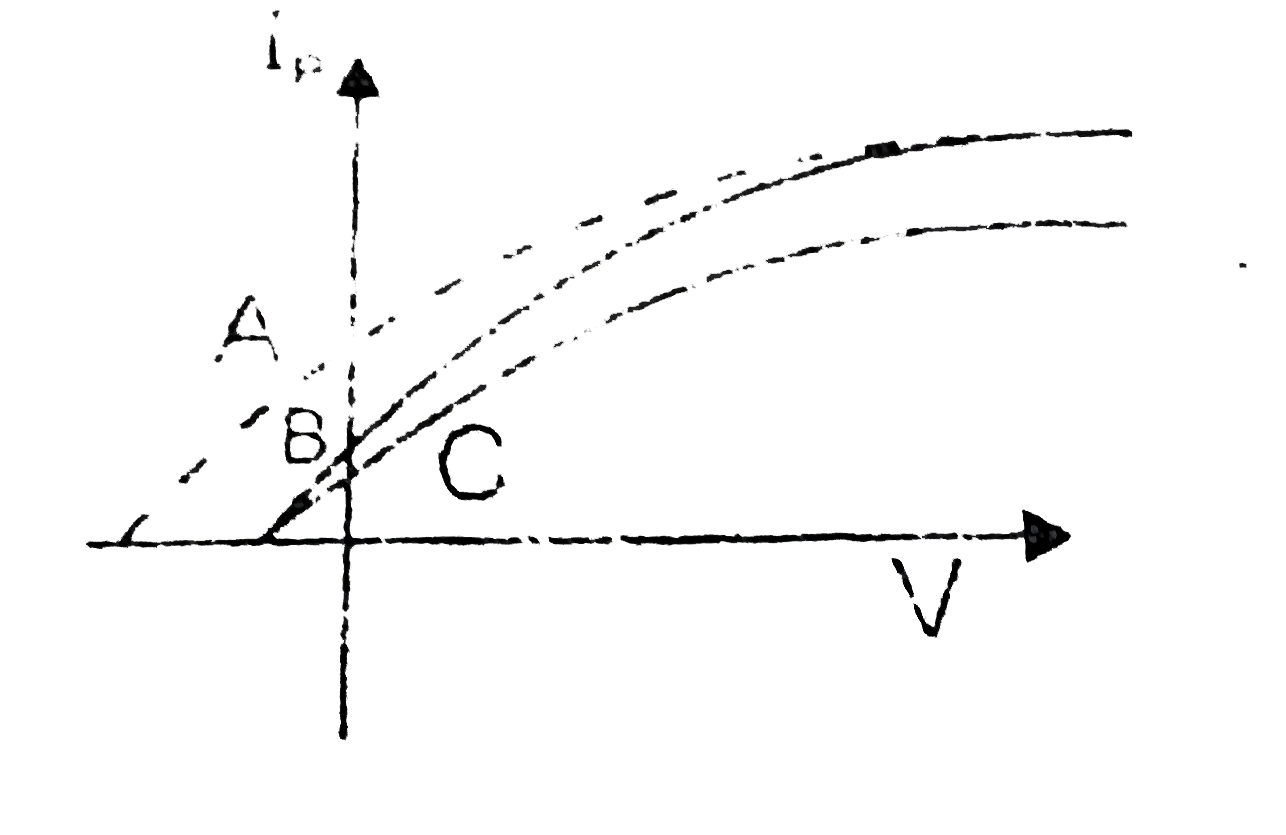
- The graph is showing the photocurrent with the applied voltage of a ph...
Text Solution
|
- If the atom(100)Fm^(257) follows the Bohr model the radius of (100)Fm^...
Text Solution
|
- A pulse of light of duration 100ns is absorbed completely by a small o...
Text Solution
|
- Which one the following statement is wrong , in the context of X - ray...
Text Solution
|
- The de-Broglie wavelength of a tennis ball of mass 60 g moving with a ...
Text Solution
|
- Shows the energy levels for an electron in a certain atom. Which trans...
Text Solution
|
- In a hydrogen like atom electron makes transition from an energy level...
Text Solution
|
- A block of mass m is directly pulled up slowly on a smooth inclined pl...
Text Solution
|
- The points 'A' and 'B' of a disc are pulled with velocity 'V' as shown...
Text Solution
|
- A car moves around a curve at a constant speed. When the car goes arou...
Text Solution
|
- A block of mass m starts at rest at height on a frictionless inclined ...
Text Solution
|
- Figure shows a smooth track, a part of which is a circle of radius r. ...
Text Solution
|
- A particle is revolving in a circle with increasing its speed uniforml...
Text Solution
|
- A system is shown in the figure. Block A moves with velocity 10m//s. T...
Text Solution
|
- The minimum work done required to accelerate a truck on a horizontal r...
Text Solution
|
- A block A with mass 100kg is resting on another block B of mass 200kg....
Text Solution
|
- A heavy particle of mass 1kg suspended from a massless string attached...
Text Solution
|
- Following statements are given for the motion of a particle along the ...
Text Solution
|
- Acceleration of pulleys and blocks are as shown in the figure. All pul...
Text Solution
|
- A wedge (inclination theta = 30^(@) from horizontal) is moving with an...
Text Solution
|