Home
Class 11
PHYSICS
The graph between the (velocity^(2)) and...

The graph between the `(velocity^(2))` and temperature `T` of a gas is

A

B

C

D

Text Solution

AI Generated Solution

The correct Answer is:
To find the relationship between the square of the velocity (V²) of a gas and its temperature (T), we can follow these steps: ### Step-by-Step Solution: 1. **Understand the RMS Velocity Formula**: The root mean square (RMS) velocity of gas molecules is given by the formula: \[ V_{rms} = \sqrt{\frac{3RT}{m}} \] where \( R \) is the universal gas constant, \( T \) is the temperature, and \( m \) is the molecular weight of the gas. **Hint**: Recall the definition of RMS velocity and the variables involved. 2. **Square the RMS Velocity**: To find the relationship between V² and T, we square the RMS velocity: \[ V^2 = \left(\sqrt{\frac{3RT}{m}}\right)^2 = \frac{3RT}{m} \] **Hint**: Remember that squaring a square root cancels the square root. 3. **Identify the Proportionality**: From the equation \( V^2 = \frac{3R}{m}T \), we can see that V² is directly proportional to T. The term \( \frac{3R}{m} \) is a constant. **Hint**: Look for the relationship in the form of \( y = kx \) where \( k \) is a constant. 4. **Graphical Representation**: Since V² is proportional to T, if we plot V² on the y-axis and T on the x-axis, the graph will be a straight line. This line will pass through the origin (0,0) because when T = 0, V² also equals 0. **Hint**: Consider the characteristics of linear graphs and what it means for a line to pass through the origin. 5. **Conclusion**: Therefore, the graph between the square of the velocity (V²) and temperature (T) of a gas is a straight line passing through the origin. **Hint**: Summarize the findings to confirm the type of graph you expect. ### Final Answer: The graph between the velocity squared (V²) and temperature (T) of a gas is a straight line passing through the origin.

To find the relationship between the square of the velocity (V²) of a gas and its temperature (T), we can follow these steps: ### Step-by-Step Solution: 1. **Understand the RMS Velocity Formula**: The root mean square (RMS) velocity of gas molecules is given by the formula: \[ V_{rms} = \sqrt{\frac{3RT}{m}} ...
Promotional Banner

Topper's Solved these Questions

  • SOUND WAVES

    RESONANCE ENGLISH|Exercise Solved Examples|24 Videos
  • SOUND WAVES

    RESONANCE ENGLISH|Exercise Board Level Exercise|33 Videos
  • SIMPLE HARMONIC MOTION

    RESONANCE ENGLISH|Exercise Exercise|28 Videos
  • STRING WAVES

    RESONANCE ENGLISH|Exercise Exercise|32 Videos

Similar Questions

Explore conceptually related problems

There are two samples A and B, which contains two different gases. Each sample has one mole of a gas. Graph between internal energy (E) and temperature (T) as shown in figure, then:

If, for a given substance, T_(B) is the melting point and T_(A) is the freezing point, then the correct variation of entropy by the graph between entropy change (DeltaS) and temperature is:

The graph between log t_(1//2) and log a at a given temperature is Rate of this reaction will …….with passage of time

The slope of the graph between log P and log V at constant temperature for a given mass of gas is

If a piece of metal is heated to temperature theta and the allowed to cool in a room which is at temperature theta_0 , the graph between the temperature T of the metal and time t will be closet to

The graph between velocity and position for a damped oscillation will be-

Figure shows a parabolic graph between T and (1)/(V) (T = temperature, V = Volume) for a gas undergoing an adiabatic process. If the ratio of rms velocity of molecules and speed of sound in the gas at the same temperature is sqrtn , then find the value of n.

What is the type of graph between log P and log ((1)/(V)) at constant temperature for a given amount of gas ?

The graph of pressure and temperature for an ideal gas is as shown in figure. The given process is

In the graph plotted between vapour pressure (V.P.) and temperature (T),

RESONANCE ENGLISH-SOUND WAVES-Exercise- 3 PART - I
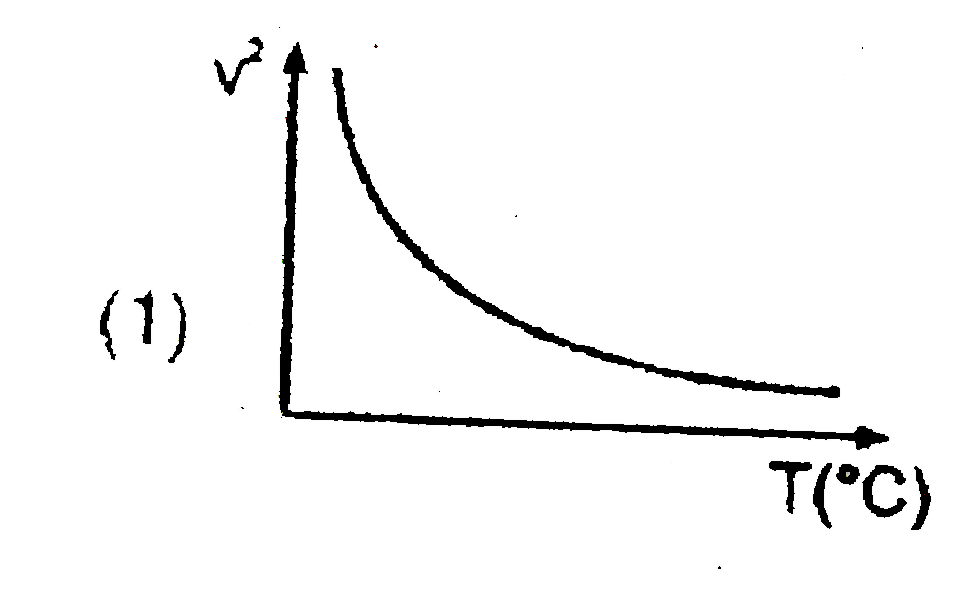
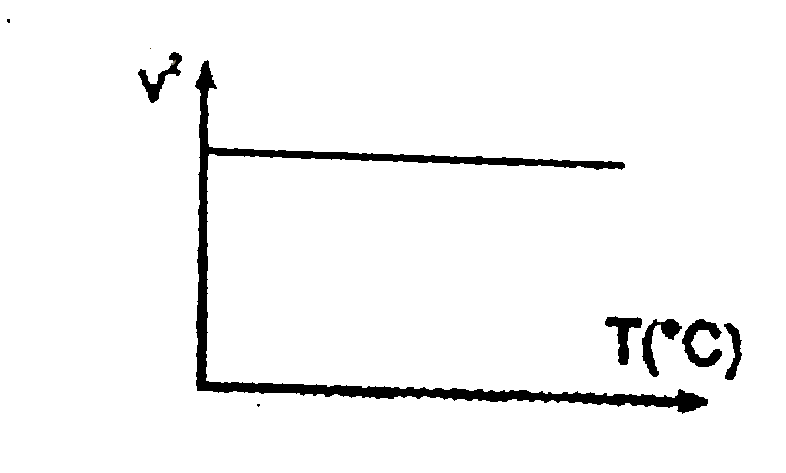
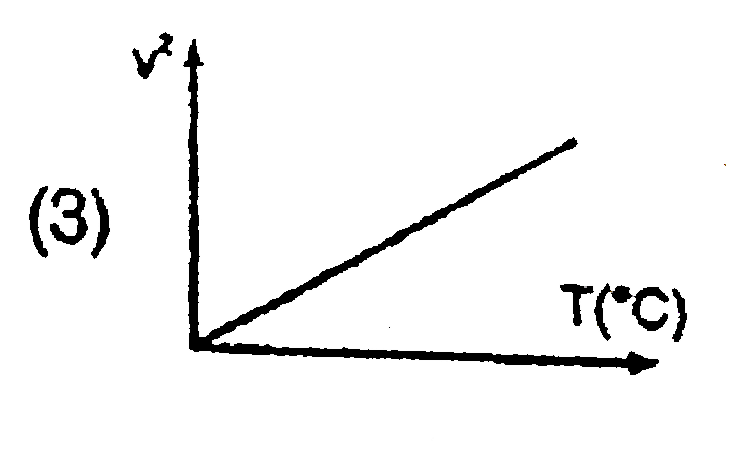
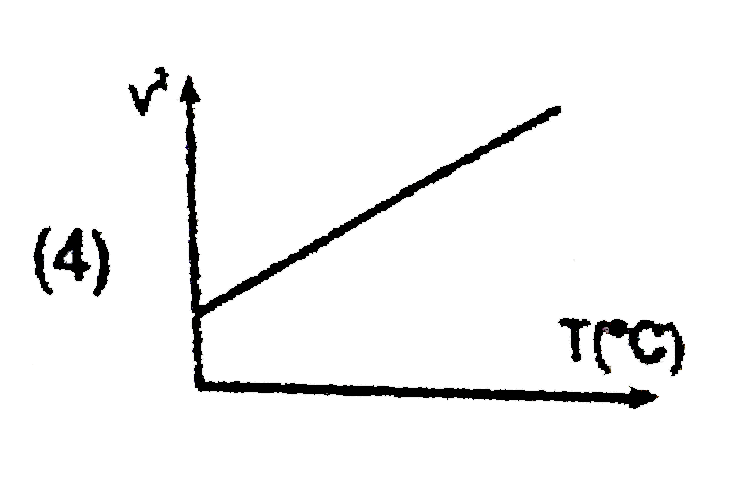
  1. The graph between the (velocity^(2)) and temperature T of a gas is

    Text Solution

    |

  2. An observer standing on a railway crossing receives frequencies 2.2 kH...

    Text Solution

    |

  3. An open pipe is in resonance in 2nd harmonic with frequency f(1). Now ...

    Text Solution

    |

  4. Two plane harmonic sound waves are expressed by the equations. y(1)(...

    Text Solution

    |

  5. Two plane harmonic sound waves are expressed by the equations. y(1)(...

    Text Solution

    |

  6. Two plane harmonic sound waves are expressed by the equations. y(1)(...

    Text Solution

    |

  7. Two trains A and B moving with speeds 20m//s and 30m//s respectively i...

    Text Solution

    |

  8. Two trains A and B are moving with speeds 20 m/s and 30 m/s, respectiv...

    Text Solution

    |

  9. Two trains A and B are moving with speeds 20 m//s respectively in the ...

    Text Solution

    |

  10. A vibrating string of certain length l under a tension T resonates wit...

    Text Solution

    |

  11. A student performed the experiment to measure the speed of sound in ai...

    Text Solution

    |

  12. A stationary source is emitting sound at a fixed frequency f(o), which...

    Text Solution

    |

  13. hollow pipe of length 0.8 m is closed at one end. At its open end a 0....

    Text Solution

    |

  14. A police car with a siren of frequency 8 kHz is moving with uniform ve...

    Text Solution

    |

  15. A person blows into the open-end of a long pipe. As a result, a high-p...

    Text Solution

    |

  16. A student is performing the experiment of resonance column. The diamet...

    Text Solution

    |

  17. Two vehicles, each moving with speed u on the same horizontal straight...

    Text Solution

    |

  18. A student is performing an experiment using a resonance column and a t...

    Text Solution

    |

  19. Four harmonic waves of equal frequency and equal intensity I(0) have p...

    Text Solution

    |

  20. An observer moves towards a stationary source of sound with a velocity...

    Text Solution

    |

  21. A whistle producing sound waves of frequencies 9500 Hz and above is ap...

    Text Solution

    |