Home
Class 11
PHYSICS
Which of the following curve represent v...

Which of the following curve represent variation of density of water with temperature best-

A

B

C

D

Text Solution

AI Generated Solution

The correct Answer is:
To determine the variation of density of water with temperature, we need to analyze the behavior of water as its temperature changes, particularly around the critical temperature of 4 degrees Celsius. ### Step-by-Step Solution: 1. **Understanding Density**: Density (\( \rho \)) is defined as mass (\( m \)) per unit volume (\( V \)): \[ \rho = \frac{m}{V} \] 2. **Behavior of Water at Different Temperatures**: - At **0 degrees Celsius** and below, water exists in a solid state (ice). In this state, the molecules are closely packed, leading to a relatively high density. - As the temperature increases from 0 degrees Celsius to **4 degrees Celsius**, the density of water increases. This is because the structure of ice breaks down, and the water molecules become more compact. 3. **Maximum Density at 4 Degrees Celsius**: - At **4 degrees Celsius**, water reaches its maximum density. This is a unique property of water, where it is denser than at both lower and higher temperatures. 4. **Behavior Above 4 Degrees Celsius**: - When the temperature exceeds **4 degrees Celsius**, the density of water begins to decrease. This is because the water molecules gain energy, move apart, and occupy a larger volume, thus reducing the density. 5. **Graphical Representation**: - The graph representing the density of water versus temperature will show an increase in density as the temperature rises from 0 to 4 degrees Celsius, reaching a peak at 4 degrees Celsius, and then a decrease in density as the temperature continues to rise beyond 4 degrees Celsius. 6. **Conclusion**: - The curve that best represents the variation of density of water with temperature will show a peak at 4 degrees Celsius, indicating maximum density, followed by a decline in density as the temperature increases further. ### Final Answer: The correct option is the one that represents a curve with a maximum point at 4 degrees Celsius, indicating that the density of water is highest at this temperature and decreases on either side of it. ---
Promotional Banner

Topper's Solved these Questions

  • ATOMIC PHYSICS

    RESONANCE ENGLISH|Exercise Exercise|32 Videos
  • CALORIMETRY AND THERMAL EXPANSION

    RESONANCE ENGLISH|Exercise Advanced Level Problems|13 Videos

Similar Questions

Explore conceptually related problems

Which of the following graph represents the variation of resistivity ( rho ) with temperature (T) for copper?

Which of the following graph shows the variationi of density of water increase in temperature ?

Which of the following curves represents the Henry's law ?

Which of the following curves represent(s) Boyle's law?

Which one of the following graphs represents variation of specific heat capacity of water with temperature?

Which of the following represents the heavy water?

Which of the following represents logistic growth curve?

Which of the following curve represents the variation of lambda_(M) with sqrt(C) for AgNO_(3) ?

A point source of light is used in an experiment on photoelectric effect . Which of the following curves best represents the variation of photo current (i) with distance (d) of the source from the emitter ?

A ball is thrown downward with some velocity into a.viscous liquid. Which of the following curves represents correct variation for velocity versus time?

RESONANCE ENGLISH-CALORIMETRY-Exercise
  1. The amount of heat required to change the state of 1 kg of substance a...

    Text Solution

    |

  2. The water equivatent of a 400 g copper calorimeter (specific heat =0.1...

    Text Solution

    |

  3. Heat required to convert 1 g of ice at 0^(@)C into steam at 100 ^(@)C ...

    Text Solution

    |

  4. Thermal capacity of 40 g of aluminium (s = 0.2 cal//g - K) is

    Text Solution

    |

  5. Boiling water is changing into steam. Under this condition, the specif...

    Text Solution

    |

  6. One kg of ice at 0^(@)C is mixed with 1 kg of water at 10^(@)C. The re...

    Text Solution

    |

  7. A metallic ball and highly stretched spring are made of the same mater...

    Text Solution

    |

  8. If a bimetallic strip is heated, it will

    Text Solution

    |

  9. Two holes of unequal diameters d(1) and d(2)(d(1)gt d(2)) are cut in m...

    Text Solution

    |

  10. A metallic bar is heated from 0^(@)C to 100^(@)C. The coefficient of l...

    Text Solution

    |

  11. A pendulum clock has an iron pendulum 1 m long (alpha("iron")=10^(-5) ...

    Text Solution

    |

  12. If the length of a cylinder on heating increases by 2%, the area of it...

    Text Solution

    |

  13. The volume of a solid decreases by 0.6% when it is cooled through 50^(...

    Text Solution

    |

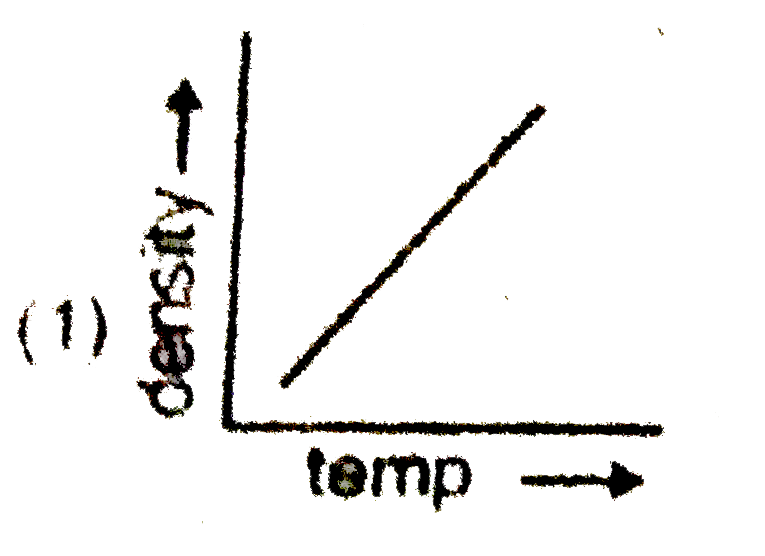
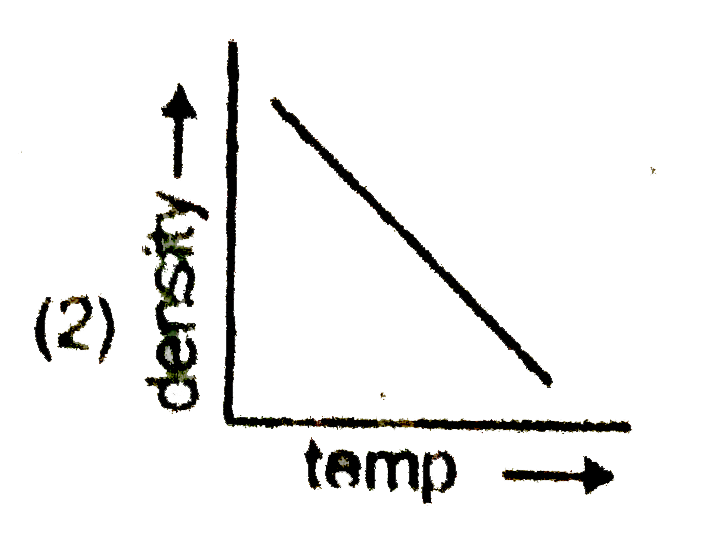
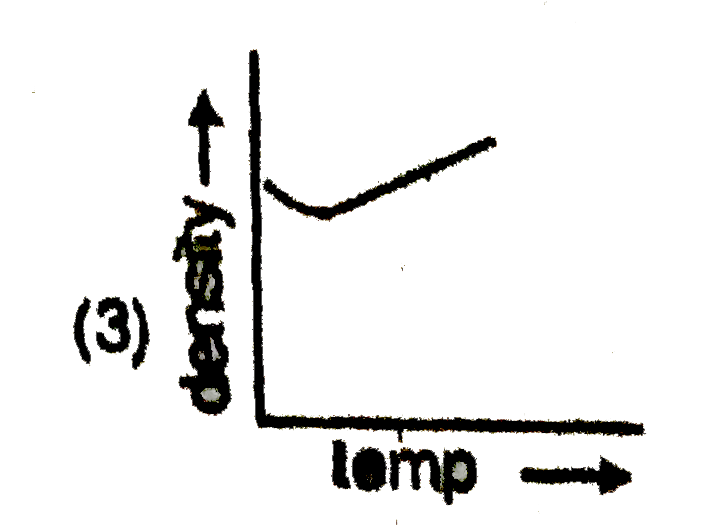
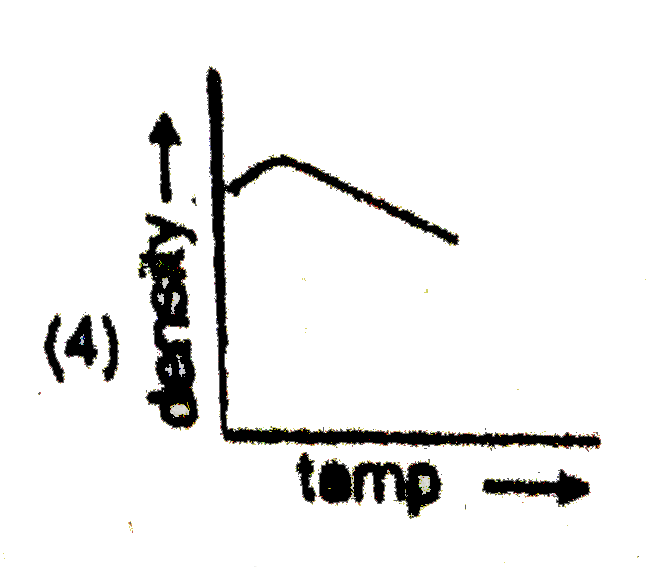
  14. Which of the following curve represent variation of density of water w...

    Text Solution

    |

  15. A rectangular block is heated from 0^(@)C to 100^(@)C. The percentage ...

    Text Solution

    |

  16. A thin copper wire of length l increases in length by 1% when heated f...

    Text Solution

    |

  17. A liquid with coefficient of volume expansion gamma is filled in a con...

    Text Solution

    |

  18. A different of temperature of 25^(@)C is equivalent to a difference of

    Text Solution

    |

  19. Statement-1: Gas thermometers are more sensitive than liquid thermomet...

    Text Solution

    |