


RESONANCE ENGLISH-PART TEST 1-Exercise
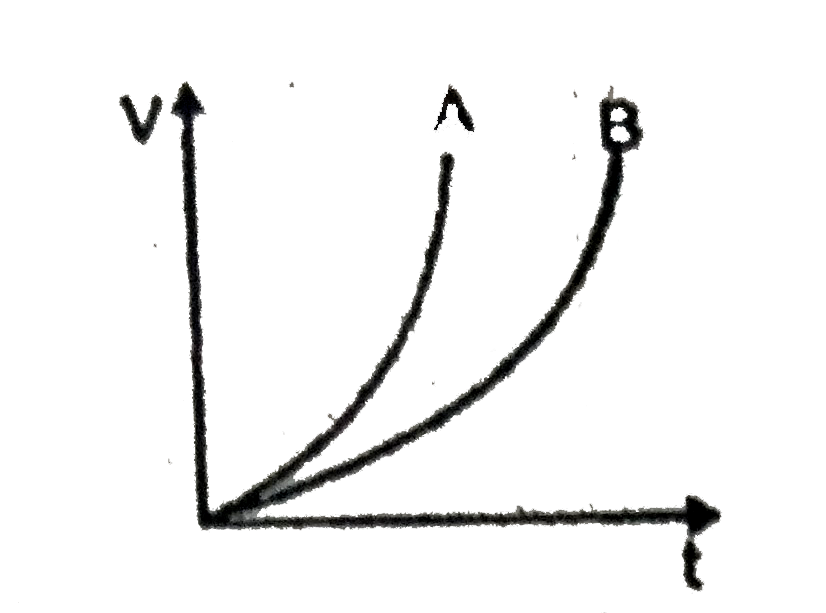
- A velocity-time graph of two vehicals A & B starting from rest at the ...
Text Solution
|
- A particle moves along a circle of radius R with a constant angular sp...
Text Solution
|
- Distance between a frog and an insect on a horizontal plane is 10m. Fr...
Text Solution
|
- A unidirectional force F varying with time t as shown in the figure a...
Text Solution
|
- A stone of mass M tied at the end of a string, is moving in a circular...
Text Solution
|
- Track OABCD (as shown in figure ) is smooth. What minimum speed has to...
Text Solution
|
- In a children\'s park, there is a slide which has a total length of 10...
Text Solution
|
- A trolley filled with sand is moving with a velocity v on a smooth hor...
Text Solution
|
- Two spheres of same mass and radius are in contact with each other. If...
Text Solution
|
- Four thin rods of same mass M and same length 1, form a square as show...
Text Solution
|
- A solid sphere, a hollow sphere and a disc, all having same mass and r...
Text Solution
|
- Statetment-1: A solid sphere and a hollow spheres of same radius and s...
Text Solution
|
- A 1 kg block is being pushed against a wall by a force F=75N as shown...
Text Solution
|
- A forceF=(3thati + 5hatj)N acts on a body due to which its displacemen...
Text Solution
|
- Particle 'A' moves with speed 10 m/s in a frictionless circular fixed ...
Text Solution
|
- A metallic wire of diameter d is lying horizontally on the surface of ...
Text Solution
|
- Two constant horizontal force F1 and F2 are acting on blocks A and B. ...
Text Solution
|
- If the energy ( E) ,velocity (v) and force (F) be taken as fundamental...
Text Solution
|
- STATEMENT-1: Two spheres undergo a perfectly elastic collision. The ki...
Text Solution
|
- A shere of mass m , moving with velocity V, enters a hanging bag of sa...
Text Solution
|