Home
Class 11
PHYSICS
The graph between photo electric current...

The graph between photo electric current and cathode potential when the anode is kept at zero potential, for light of two different intensities out of the same frequency looks like the one:

A

B

C

D

Text Solution

Verified by Experts

The correct Answer is:
A
Promotional Banner

Topper's Solved these Questions

  • PART TEST 5

    RESONANCE ENGLISH|Exercise Exercise|30 Videos
  • RIGID BODY DYNAMICS

    RESONANCE ENGLISH|Exercise Exercise|53 Videos

Similar Questions

Explore conceptually related problems

if the cathode and the anode are kept at the same potential, the emitted electrons have

A metal surface in an evacuated tube is illuminated with monochromatic light causing the emission of photoelectrons. For a given intensity of light, a graph between saturation current and potential of the electrode is given in Fig. If the experiment were repeated with light of twice the intensity but the same wavelength, which of the graphs below would best represent the new relation between I and V?(Dotted represents initial condition)

In photoelectric effect , the curve between photoelectric current and anode potential V (for different frequencies ) is shown in figure , then

From the following graph of photocurrent against collector plate potential for two different intensities of light I_1 and I_2 one can , conclude

Draw a plot showing the variation of photoelectric current with collector plate potential for two different frequencies, v_1gtv_2 of incident radiation having the same intensity. In which case will the stopping potential be higher? Justify your answer.

The figure shows a plot of photo current versus anode potential for a photosensitive surface for three different radiations. Which one of the following is a correct statement ?

The curves (a) , (b) , ( c ) and (d) show the variation between the applied potential difference (V) and the photoelectric current (i) , at two different intensities of light (I_(1) gt I_(2)) . In which figure is the correct variation shown ?

When the separation between two charges is increased, the electric potential energy of the charges

When the separation between two charges is increased, the electric potential energy of the charges

Light from a hydrogen tube is incident on the cathode of a photoelectric cell the work function of the cathode surface is 4.2 eV . In order to reduce the photo - current to zero the voltage of the anode relative to the cathode must be made

RESONANCE ENGLISH-PART TEST 6-Exercise
  1. In the following circuit readings in ammeters A1 and A2 will be -

    Text Solution

    |

  2. In the given figure, which of the diodes are forward biased?

    Text Solution

    |

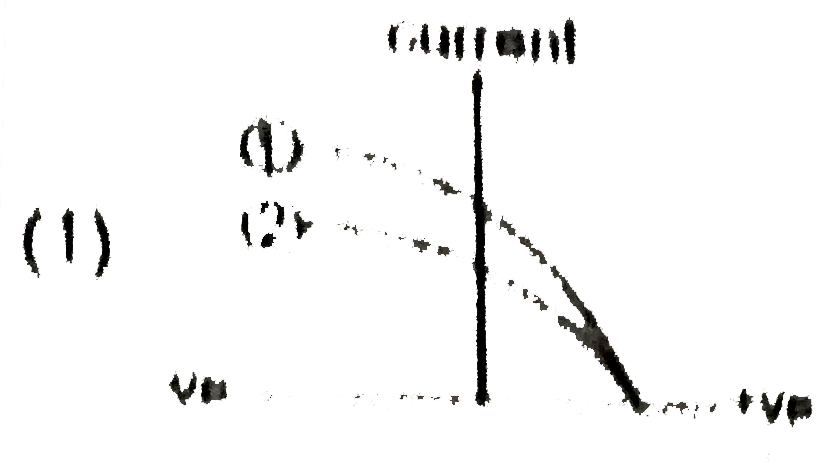
  3. The graph between photo electric current and cathode potential when th...

    Text Solution

    |

  4. For a pure semiconductor energy band shown at 0K choose correct option...

    Text Solution

    |

  5. Photo electric effect can be explained only by assuming that light A...

    Text Solution

    |

  6. Light of two different frequencies whose photons have energies 1 eV an...

    Text Solution

    |

  7. In an interference pattern the (n+4)^(th) blue bright fringe and n^(th...

    Text Solution

    |

  8. A particle of mass m is projected form ground with velocity u making a...

    Text Solution

    |

  9. When a metallic surface is illuminated with monochromatic light of wav...

    Text Solution

    |

  10. Light of wavelength 400 nm is incident continuously on a caesium ball ...

    Text Solution

    |

  11. The Rutherford alpha-particle experiment shown that most of the alpha-...

    Text Solution

    |

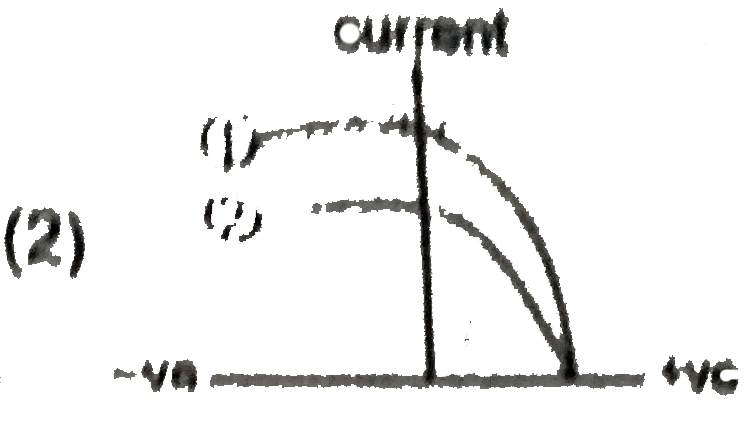
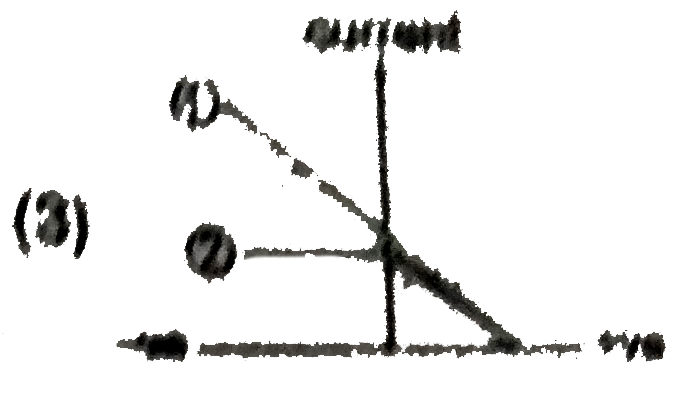
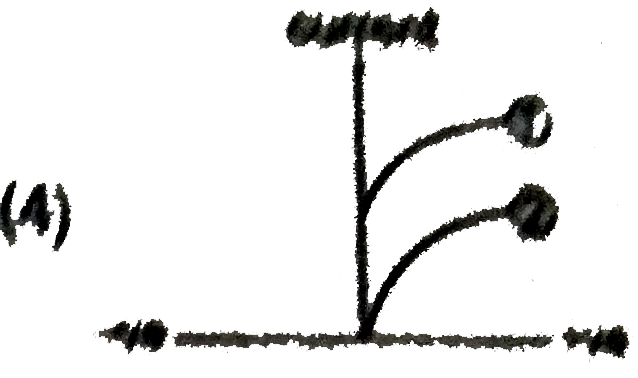
  12. Which one of the following graphs in figure shows the variation of pho...

    Text Solution

    |

  13. Two electrons starting from rest are accelerated by equal potential di...

    Text Solution

    |

  14. Let mp be the mass of a proton , mn the mass of a neutron, M1 the mass...

    Text Solution

    |

  15. In the photoelectric experiment, if we use a monochromatic light, the ...

    Text Solution

    |

  16. In a photoelectric effect experiment, stopping potential changes by 30...

    Text Solution

    |

  17. The photon radiated from hydrogen corresponding to 2^(nd) line of Lyma...

    Text Solution

    |

  18. An electron of mass m when accelerated through a potential difference ...

    Text Solution

    |

  19. A photon of energy 12.09 eV is absorbed by an electron in ground state...

    Text Solution

    |

  20. What percentage increase in wavelength leads to 75% loss of photon ene...

    Text Solution

    |