A
B
C
D
Text Solution
Verified by Experts
The correct Answer is:


Topper's Solved these Questions
ATOMIC PHYSICS
RESONANCE ENGLISH|Exercise Exercise -3 part -I JEE (Advanced)|86 VideosATOMIC PHYSICS
RESONANCE ENGLISH|Exercise Advanved level problems|17 VideosATOMIC PHYSICS
RESONANCE ENGLISH|Exercise Exercise-2 part-III one or more than one options correct type|14 VideosALTERNATING CURRENT
RESONANCE ENGLISH|Exercise HIGH LEVEL PROBLEMS|11 VideosCAPACITANCE
RESONANCE ENGLISH|Exercise High Level Problems|16 Videos
Similar Questions
Explore conceptually related problems
RESONANCE ENGLISH-ATOMIC PHYSICS-Exercise-2 Part-III : Comprehension
- A phsicist wishes to eject electrons by shining light on a metal surfa...
Text Solution
|
- A phsicist wishes to eject electrons by shining light on a metal surfa...
Text Solution
|
- A phsicist wishes to eject electrons by shining light on a metal surfa...
Text Solution
|
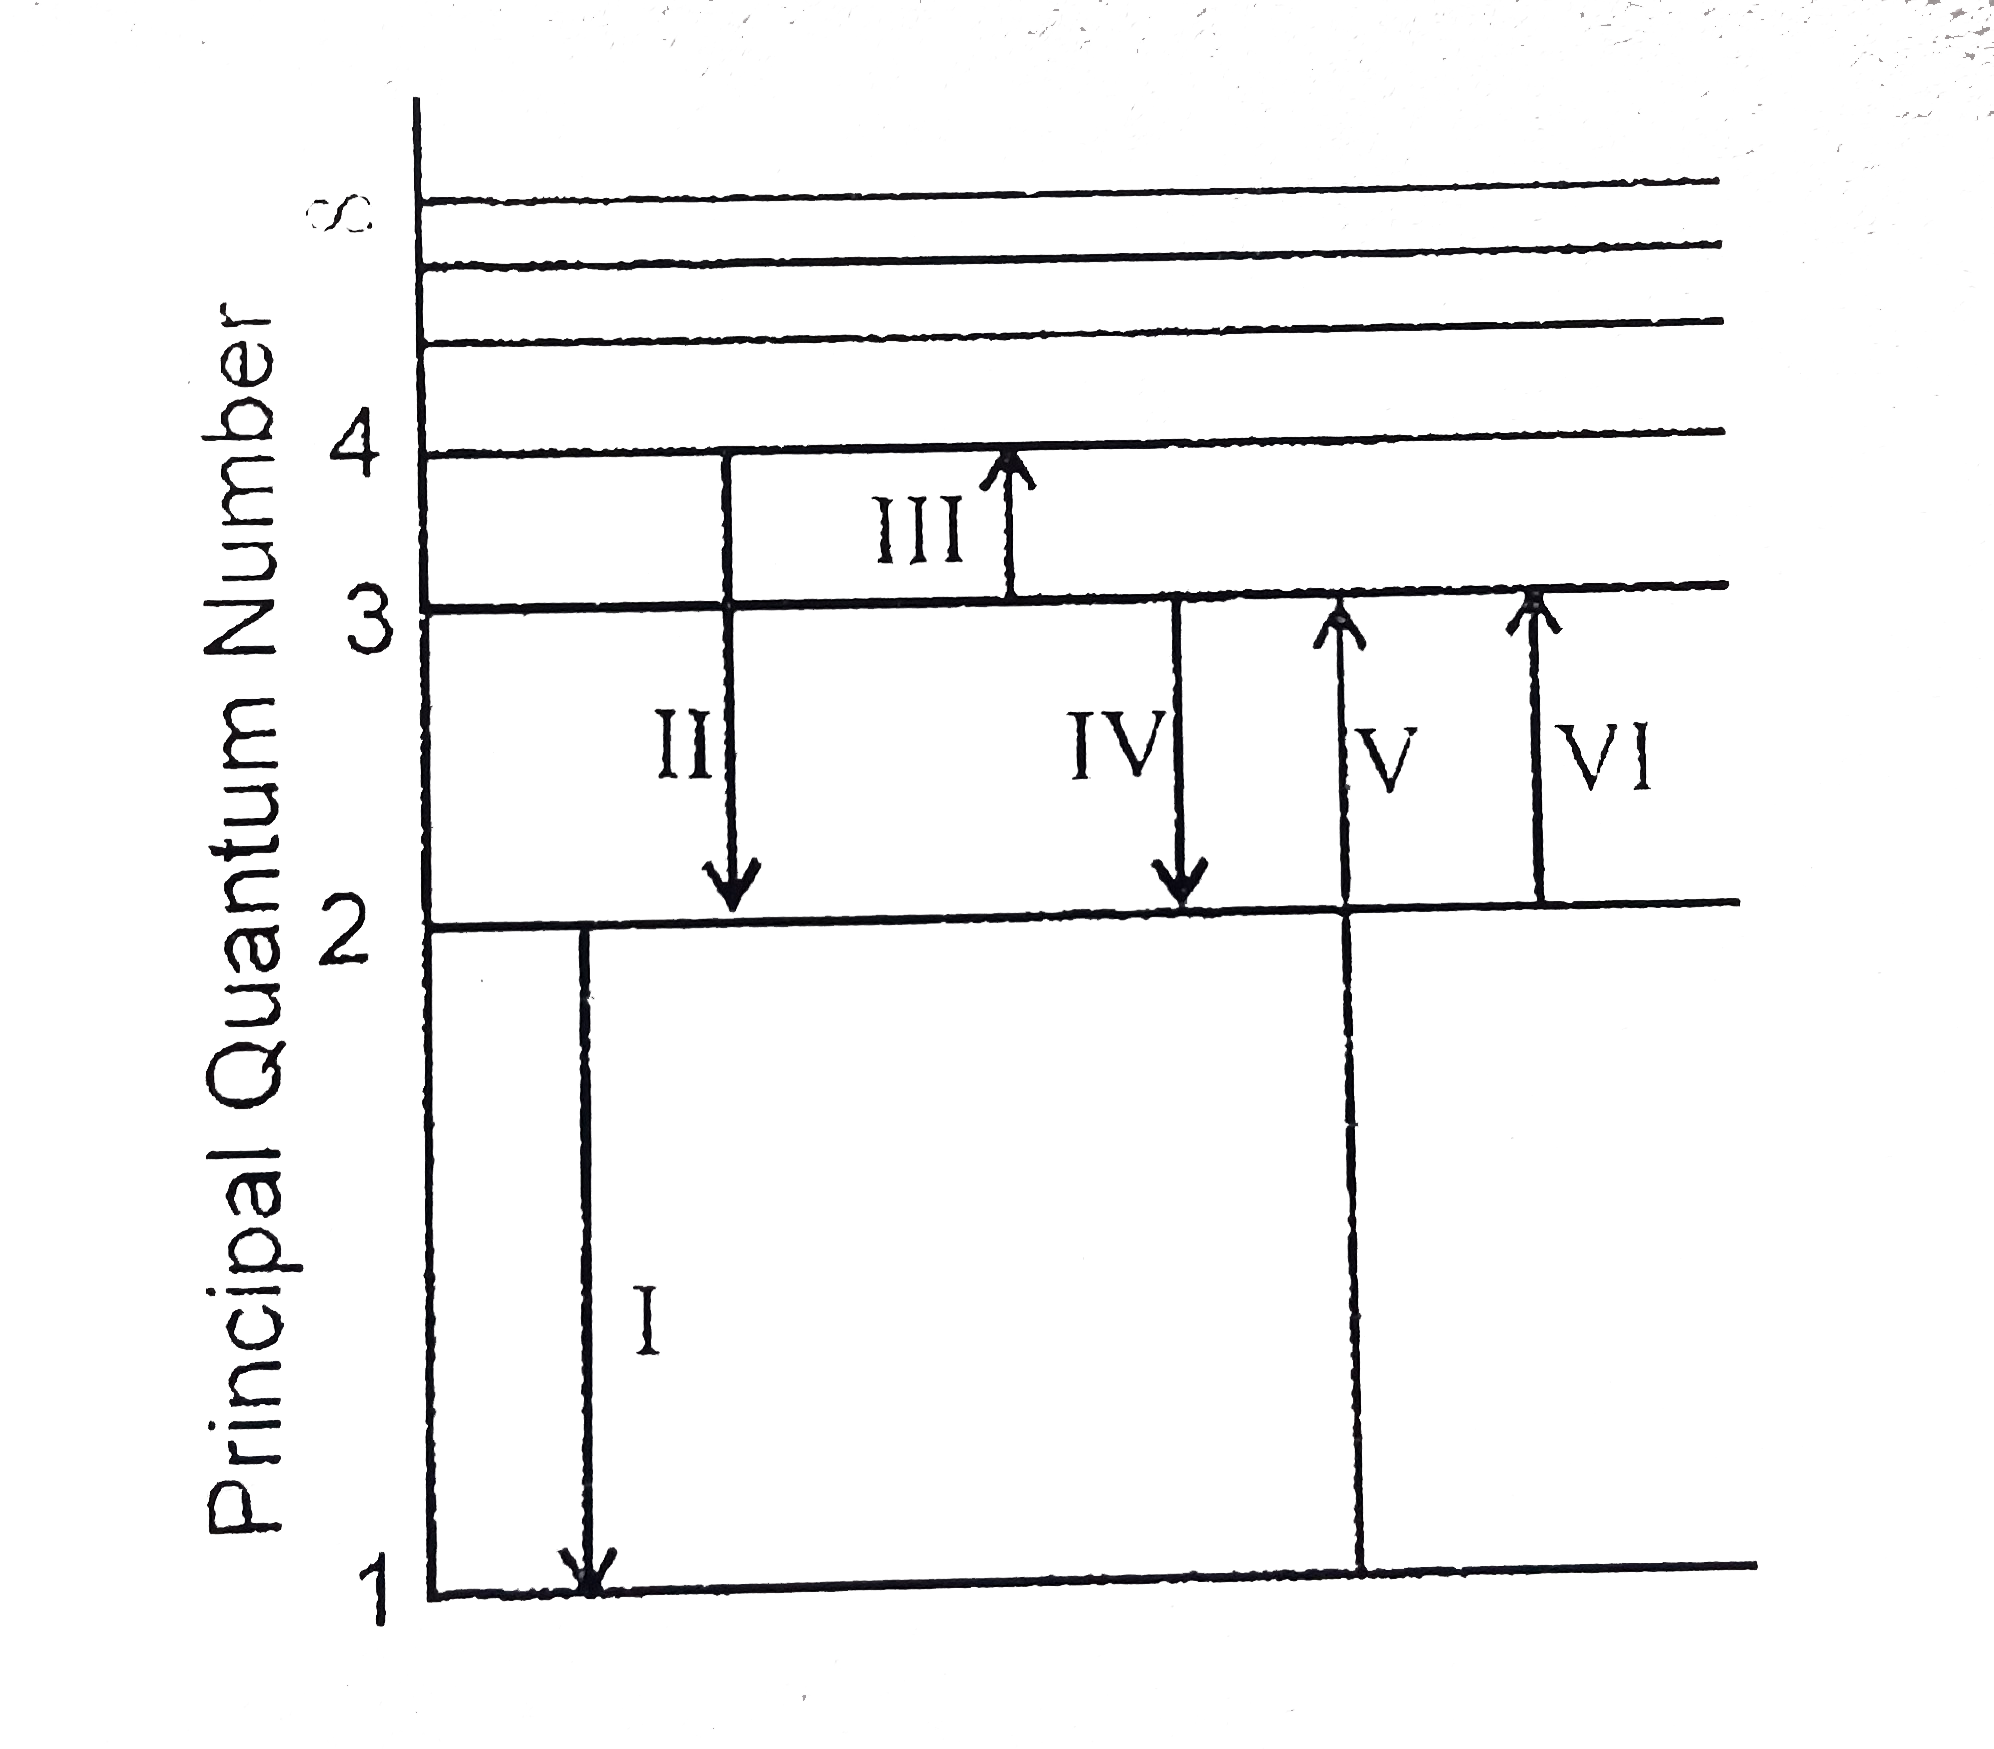
- The figure shows an energy level diagram for the hydrogen atom. Severa...
Text Solution
|
- Pertain to the following statement and figure The figure above s...
Text Solution
|
- The figure shows an energy level diagram for the hydrogen atom. Severa...
Text Solution
|
- Assume that the de-Broglie were associated with an electron can form a...
Text Solution
|
- Assume that the de-Broglie were associated with an electron can form a...
Text Solution
|
- A uniform magnetic field B exists in a region. An electrons projected...
Text Solution
|
- A uniform magnetic field B exists in a region. An electrons projected...
Text Solution
|
- A neutron beam, in which each neutron has same kinetic energy, is pass...
Text Solution
|
- A gas of hydrogen like ions is prepared in such a way that ions are on...
Text Solution
|