A
B
C
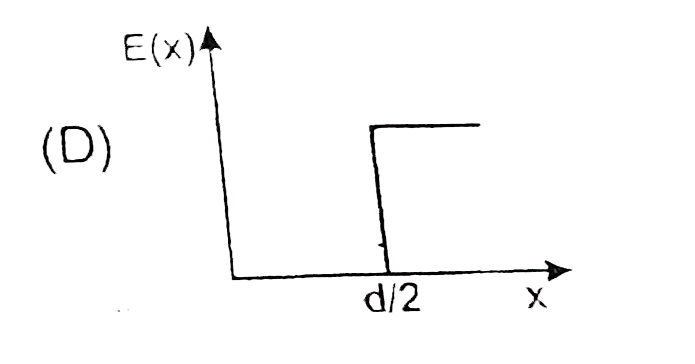
D
Text Solution
Verified by Experts


Similar Questions
Explore conceptually related problems
Recommended Questions
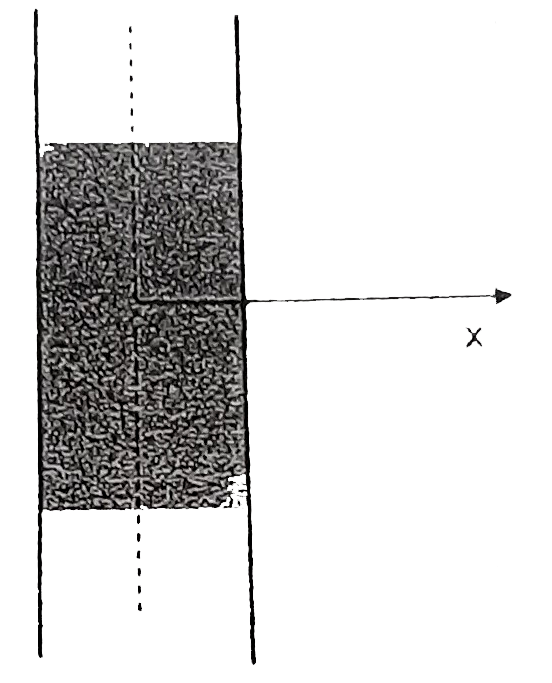
- An infinite non-conducting plate of charge has thickness d and contain...
Text Solution
|
- A nonconducting sheet of large surface area and thickness d contains u...
Text Solution
|
- An infinite non-conducting plate of charge has thickness d and contain...
Text Solution
|
- A nonconducting sheet of large surface area and thickness d contains u...
Text Solution
|
- The given graph shows variation (with distance r from centre) of (A)El...
Text Solution
|
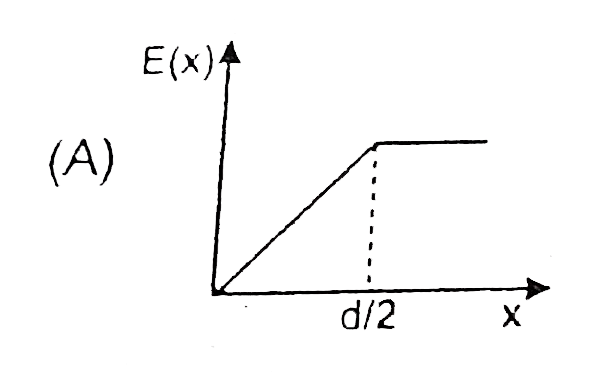
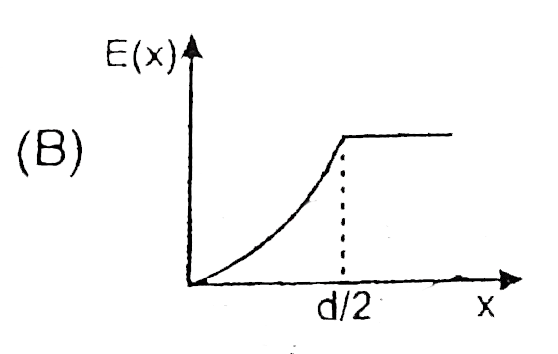
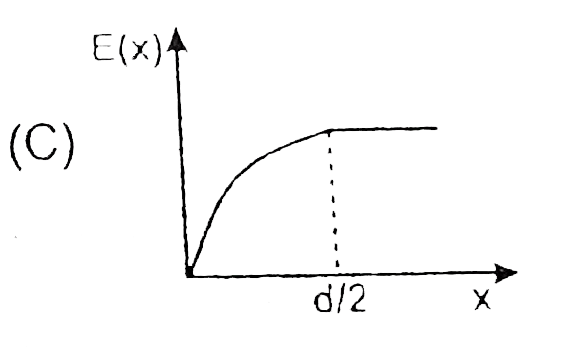
- If x is measured from the centre of uniformly charged non-conducting s...
Text Solution
|
- When a charge Q is given to a non conductuing plate & conducting plate...
Text Solution
|
- Electric field due to an infinite non-conducting sheet of surface char...
Text Solution
|
- Show graphically the variation of electric field E (y-axis) due to a c...
Text Solution
|