A
B
C
D
Text Solution
Verified by Experts
The correct Answer is:


Topper's Solved these Questions
ELASTICITY AND VISCOCITY
RESONANCE ENGLISH|Exercise Exercise- 2 PART - I|9 VideosELASTICITY AND VISCOCITY
RESONANCE ENGLISH|Exercise Exercise- 2 PART - II|6 VideosELASTICITY AND VISCOCITY
RESONANCE ENGLISH|Exercise Exercise- 1 PART - I|8 VideosDAILY PRACTICE PROBLEMS
RESONANCE ENGLISH|Exercise dpp 92 illustration|2 VideosELECTROMAGNETIC INDUCTION
RESONANCE ENGLISH|Exercise Exercise|43 Videos
Similar Questions
Explore conceptually related problems
RESONANCE ENGLISH-ELASTICITY AND VISCOCITY-Exercise- 1 PART - II
- The diameter of a brass rod is 4 mm and Young's modulus of brass is 9 ...
Text Solution
|
- A steel wire is suspended vertically from a rigid support. When loaded...
Text Solution
|
- Two wires of equal length and cross-section area suspended as shown in...
Text Solution
|
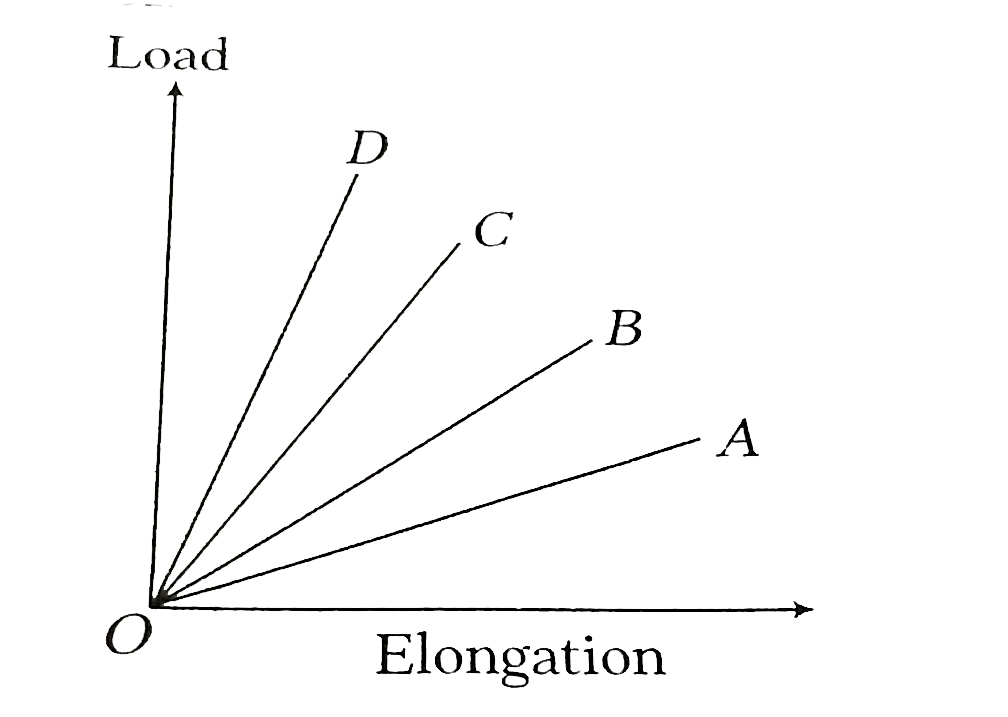
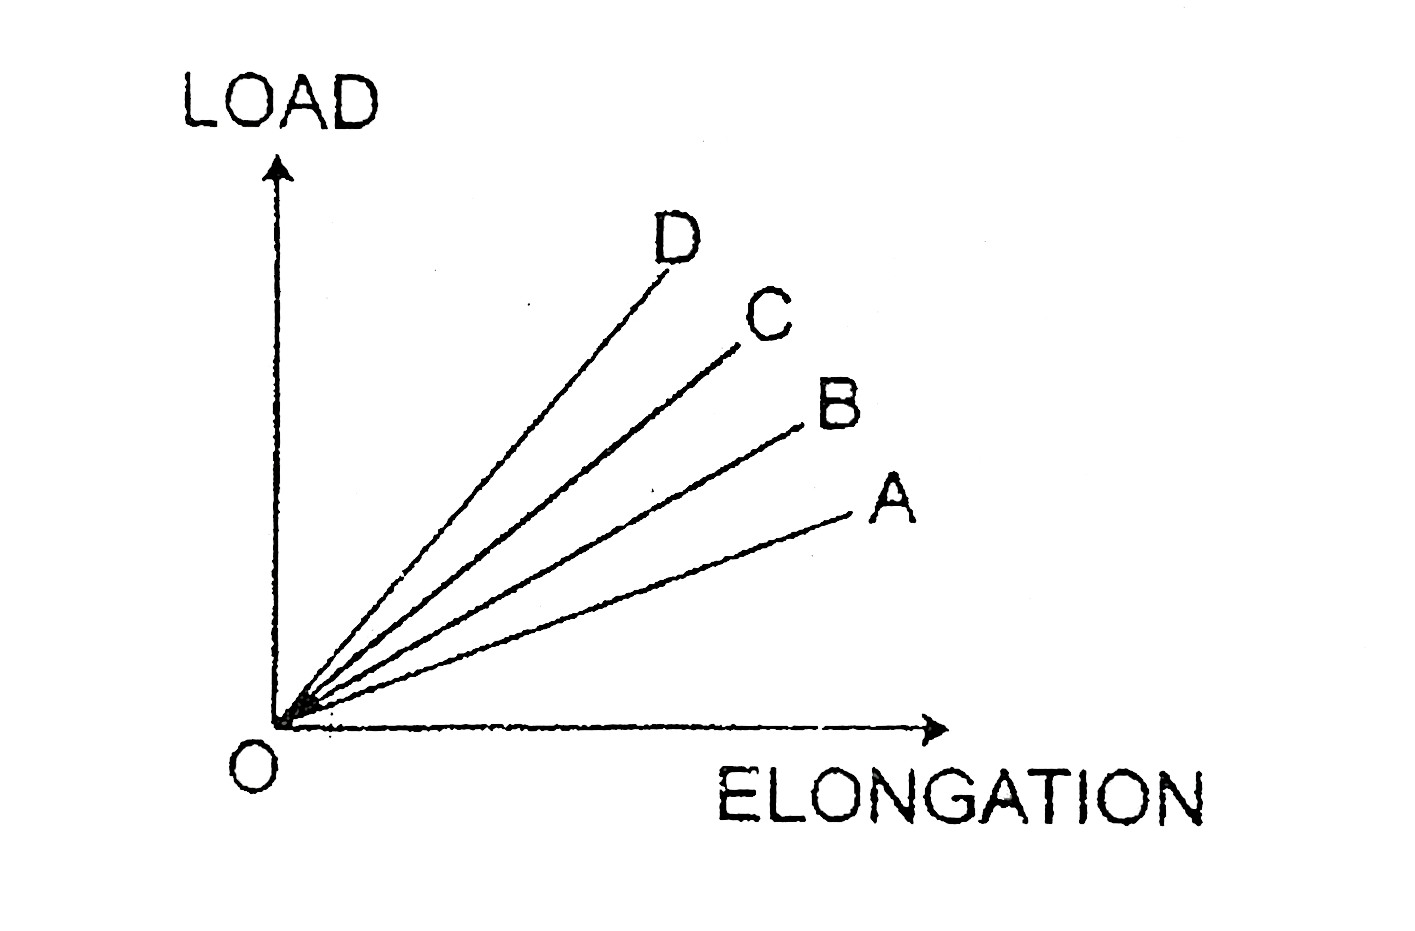
- The load versus elongation graph for four wires of the same material i...
Text Solution
|
- A square brass plate of side 1.0 m and thickness 0.0035m is subjected ...
Text Solution
|
- A metal block is experiencing an atmospheric pressure of 1 xx 10^(5)N/...
Text Solution
|
- If the potential energy of a spring is V on stretching it by 2cm, then...
Text Solution
|
- If the work done in stretching a wire by 1mm is 2J, then work necessar...
Text Solution
|
- A metal wire of length L, area of cross-section A and young's modulus ...
Text Solution
|
- An oil drop falls through air with a terminal velocity of (5xx10^(-4))...
Text Solution
|
- A drop of water of radius 0.0015 mm is falling in air. If the coeffici...
Text Solution
|
- The terminal velocity of a sphere moving through a viscous medium is :
Text Solution
|
- A sphere is dropped gently into a medium of infinite extent. As the sp...
Text Solution
|
- A solid sphere falls with a terminal velocity of 10 m//s in air. If it...
Text Solution
|