
A
B
C
D
Text Solution
Verified by Experts
The correct Answer is:


Topper's Solved these Questions
ELASTICITY AND VISCOCITY
RESONANCE ENGLISH|Exercise Exercise- 3 PART - IV|9 VideosELASTICITY AND VISCOCITY
RESONANCE ENGLISH|Exercise Advanced Level Problems|9 VideosELASTICITY AND VISCOCITY
RESONANCE ENGLISH|Exercise Exercise- 2 PART - III|8 VideosDAILY PRACTICE PROBLEMS
RESONANCE ENGLISH|Exercise dpp 92 illustration|2 VideosELECTROMAGNETIC INDUCTION
RESONANCE ENGLISH|Exercise Exercise|43 Videos
Similar Questions
Explore conceptually related problems
RESONANCE ENGLISH-ELASTICITY AND VISCOCITY-Exercise- 3 PART - I
- A small sphere falls from rest in a viscous liquid. Due to friction, h...
Text Solution
|
- A tiny spherical oil drop carrying a net charge q is balanced in still...
Text Solution
|
- A tiny spherical oil drop carrying a net charge q is balanced in still...
Text Solution
|
- Â One end of a horizontal thick copper wire of length 2L and radius ...
Text Solution
|
- During Searle's experiment zero of the Vernieer scale lies between 3.2...
Text Solution
|
- Two sphere P and Q for equal radii have densities rho1 and rho2 ...
Text Solution
|
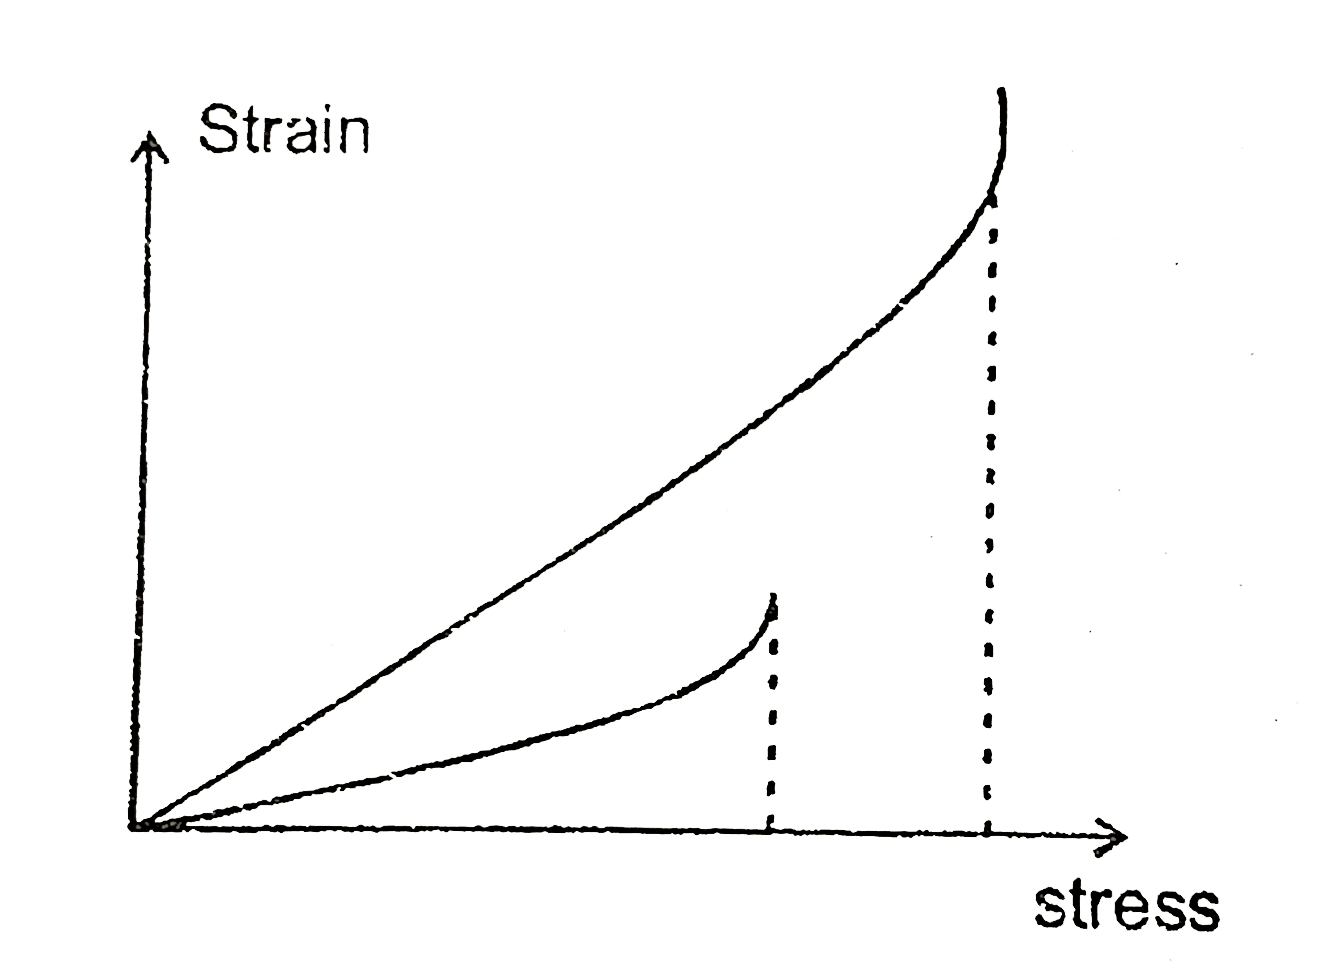
- In plotting stress versus strain curves for two materials P and Q, a s...
Text Solution
|