A
B
C
D
Text Solution
AI Generated Solution
The correct Answer is:


Topper's Solved these Questions
Similar Questions
Explore conceptually related problems
RESONANCE ENGLISH-RANK BOOSTER-All Questions
- manganese metal has the electronic configuration [Ar]3d^4 in its +3...
Text Solution
|
- If the rate of reaction, 2SO2(g)+O2(g)overset(Pt)to2SO3(g) is given by...
Text Solution
|
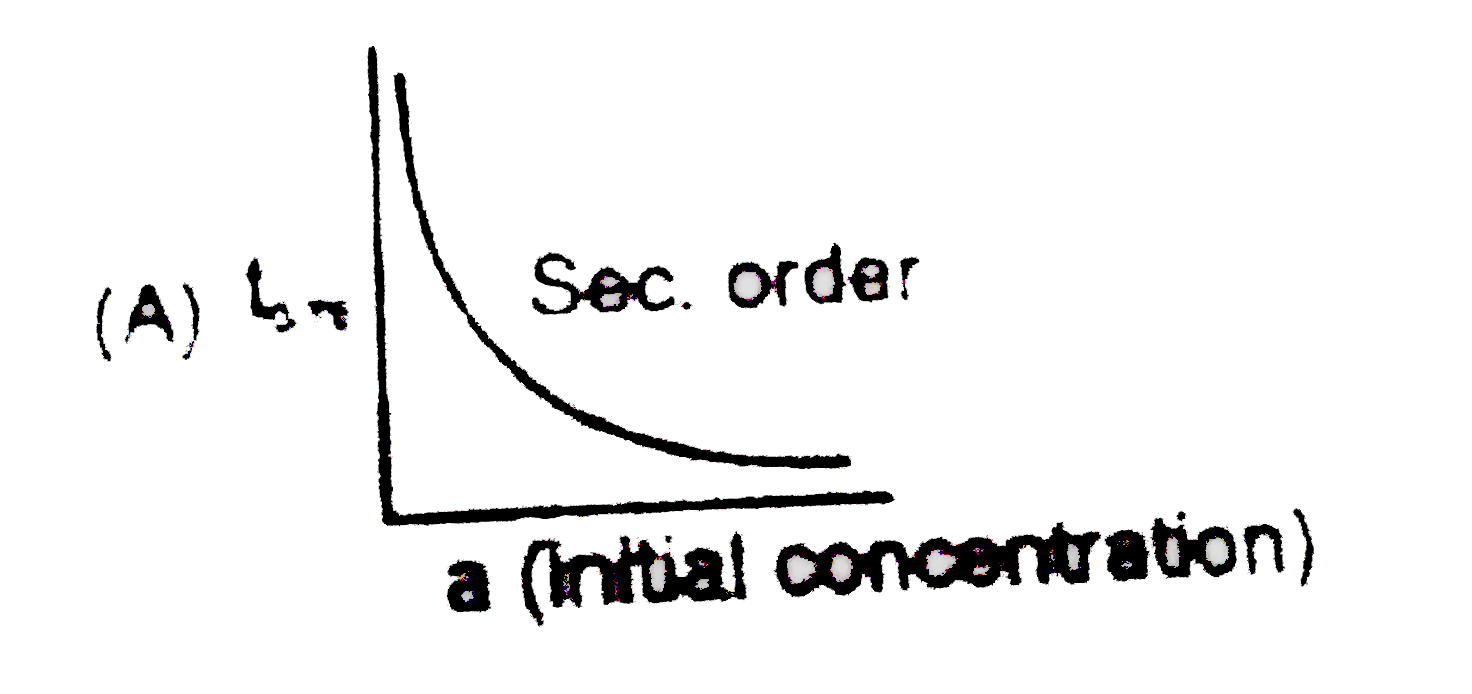
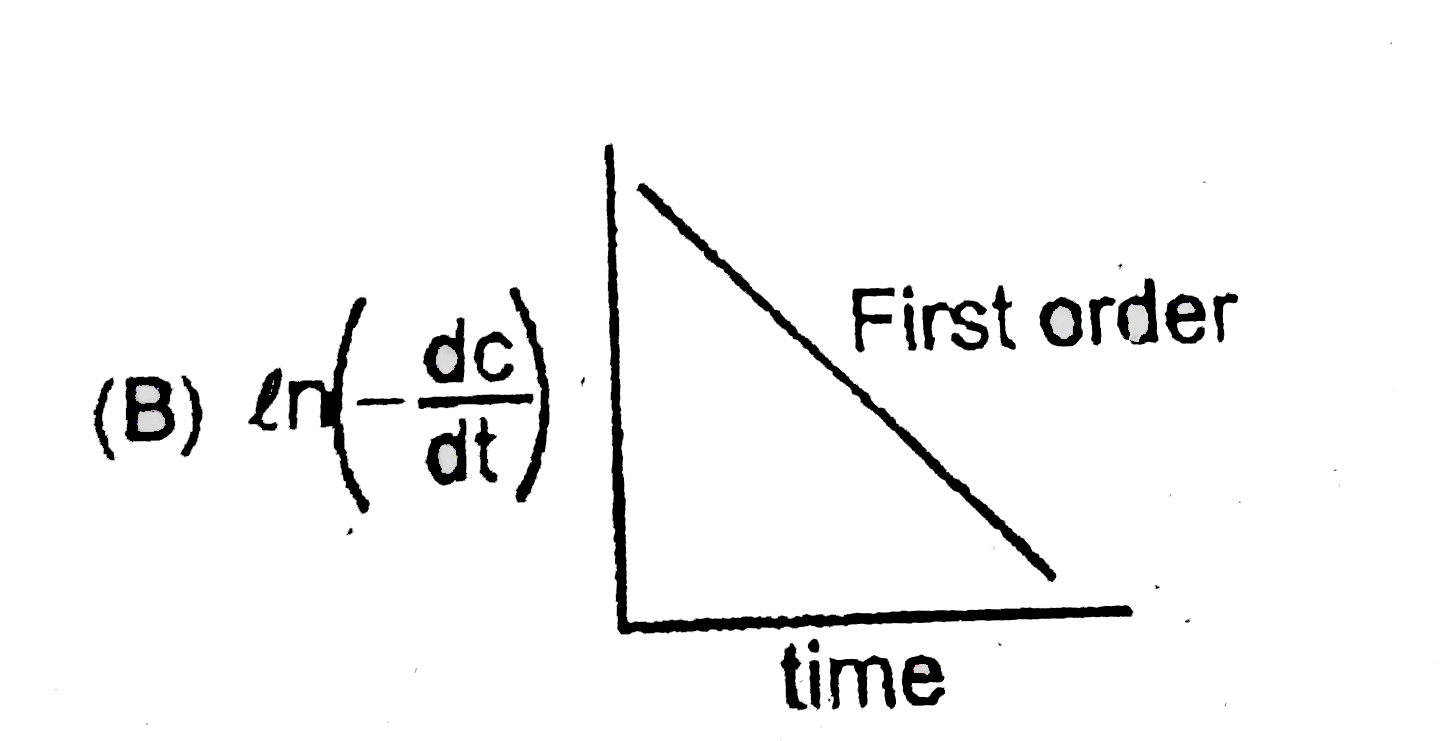
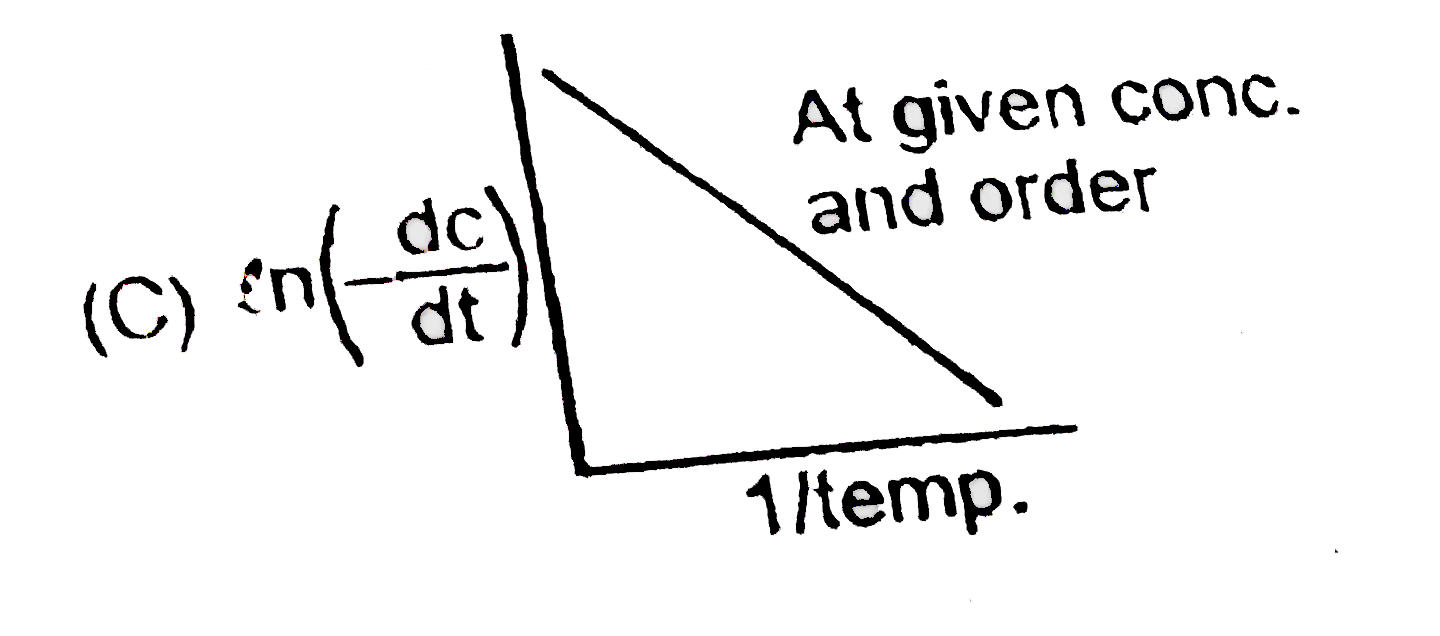
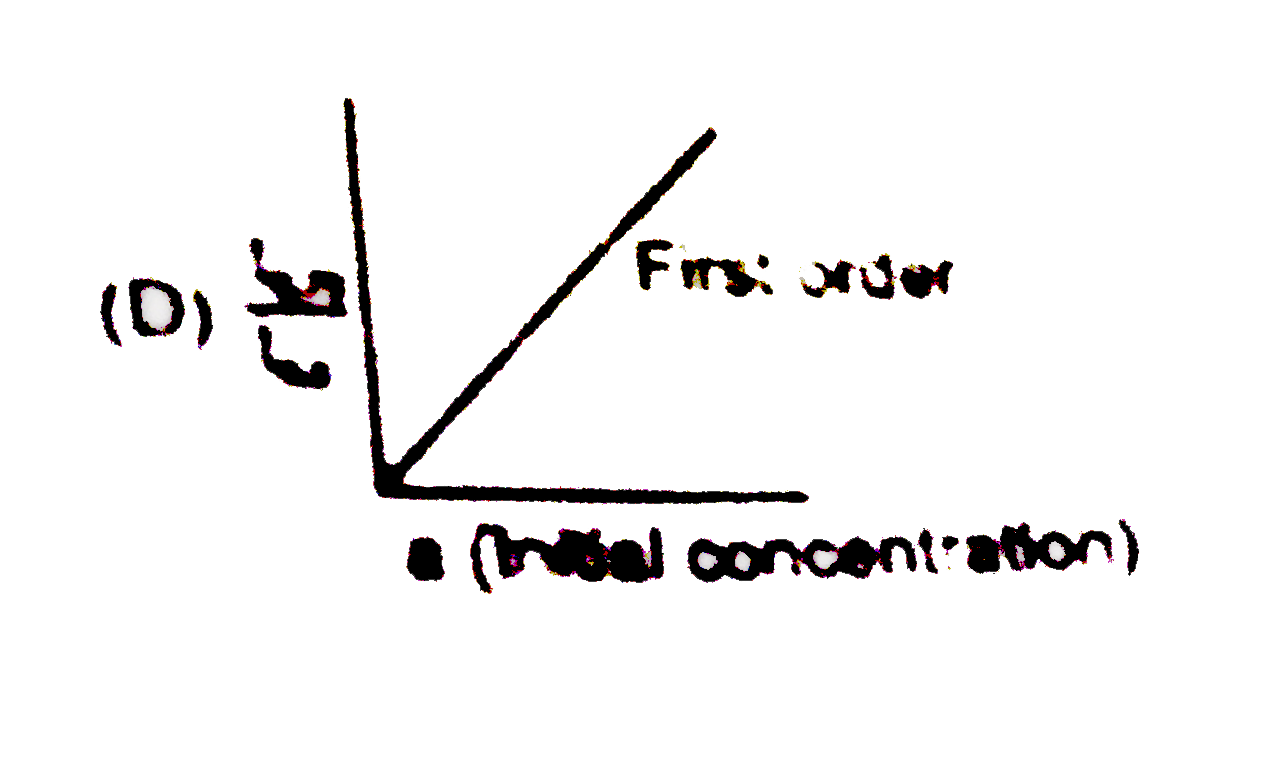
- Which is correct graph :
Text Solution
|
- For a certain reaction Ato products, the t(1//2) as a function of [A]0...
Text Solution
|
- For the reaction 2A+BtoC with the rate low (d[C])/(dt)=k[A]^(1)[B]^(-1...
Text Solution
|
- The number of moles of nitrogen present in one litre of air containing...
Text Solution
|
- The number of moles of nitrogen present in one litre of air containing...
Text Solution
|
- Indentify the true statement(s)
Text Solution
|
- The half-period T for the decomposition of ammonia on tungsten wire, w...
Text Solution
|
- The substance undergoes first order decomposition.The decomposition fo...
Text Solution
|
- Elements having complete filled outermost s and p orbital are known as...
Text Solution
|
- A certain reaction A rarr B follows the given concentration (Molarity)...
Text Solution
|
- Consider the following case of competing 1^(st) order reactions. ...
Text Solution
|
- Decomposition of 3A(g)to2B(g)+2C(g) follows first order kinetics.Initi...
Text Solution
|
- Assertion (A) : If the activation energy of a reaction is zero, temper...
Text Solution
|
- Statement-1: For A+2BtoC(rate =K[A]^(1)[B]^(0)), the half life time of...
Text Solution
|
- For I^(st) order decomposition of SO2Cl2(g), SO2Cl2(g)toSO2(g)+Cl2(g...
Text Solution
|
- A mixture of NO2 and N2O4 has a vapour density of 38.3 at 300K. What i...
Text Solution
|
- At N.T.P the volume of a gas is found to be 270mL. What will be the vo...
Text Solution
|
- The initial rate of zero order reaction of the gaseous equation A(g)to...
Text Solution
|