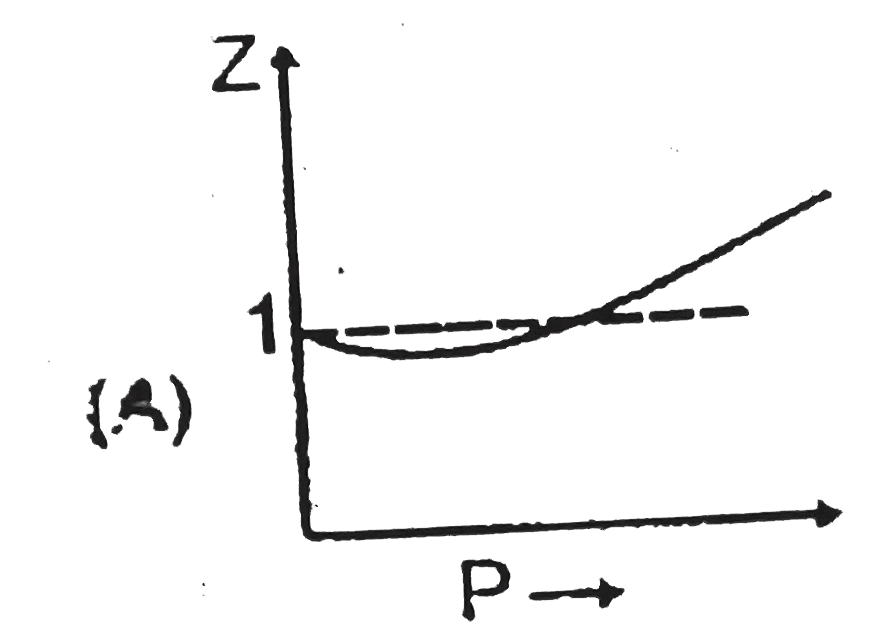
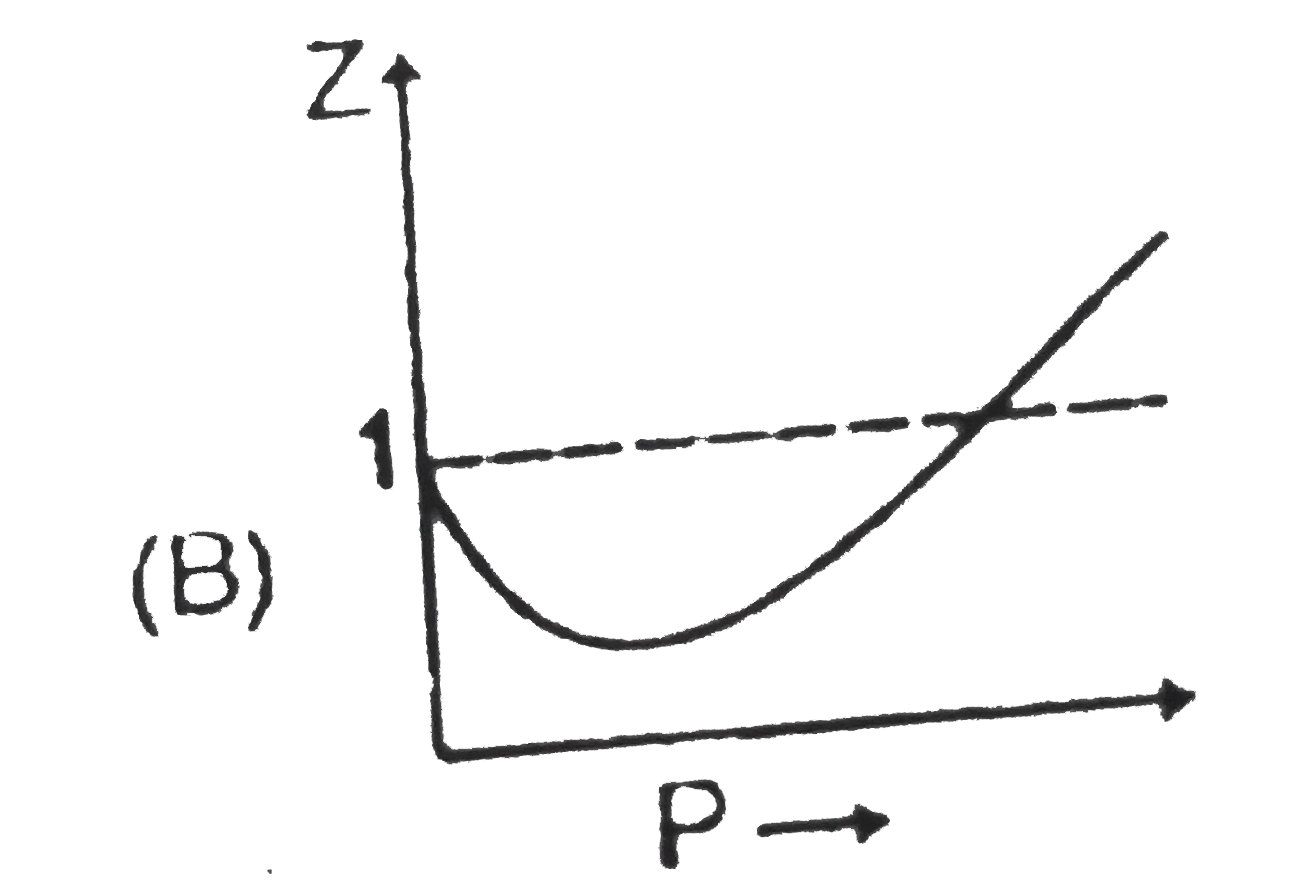
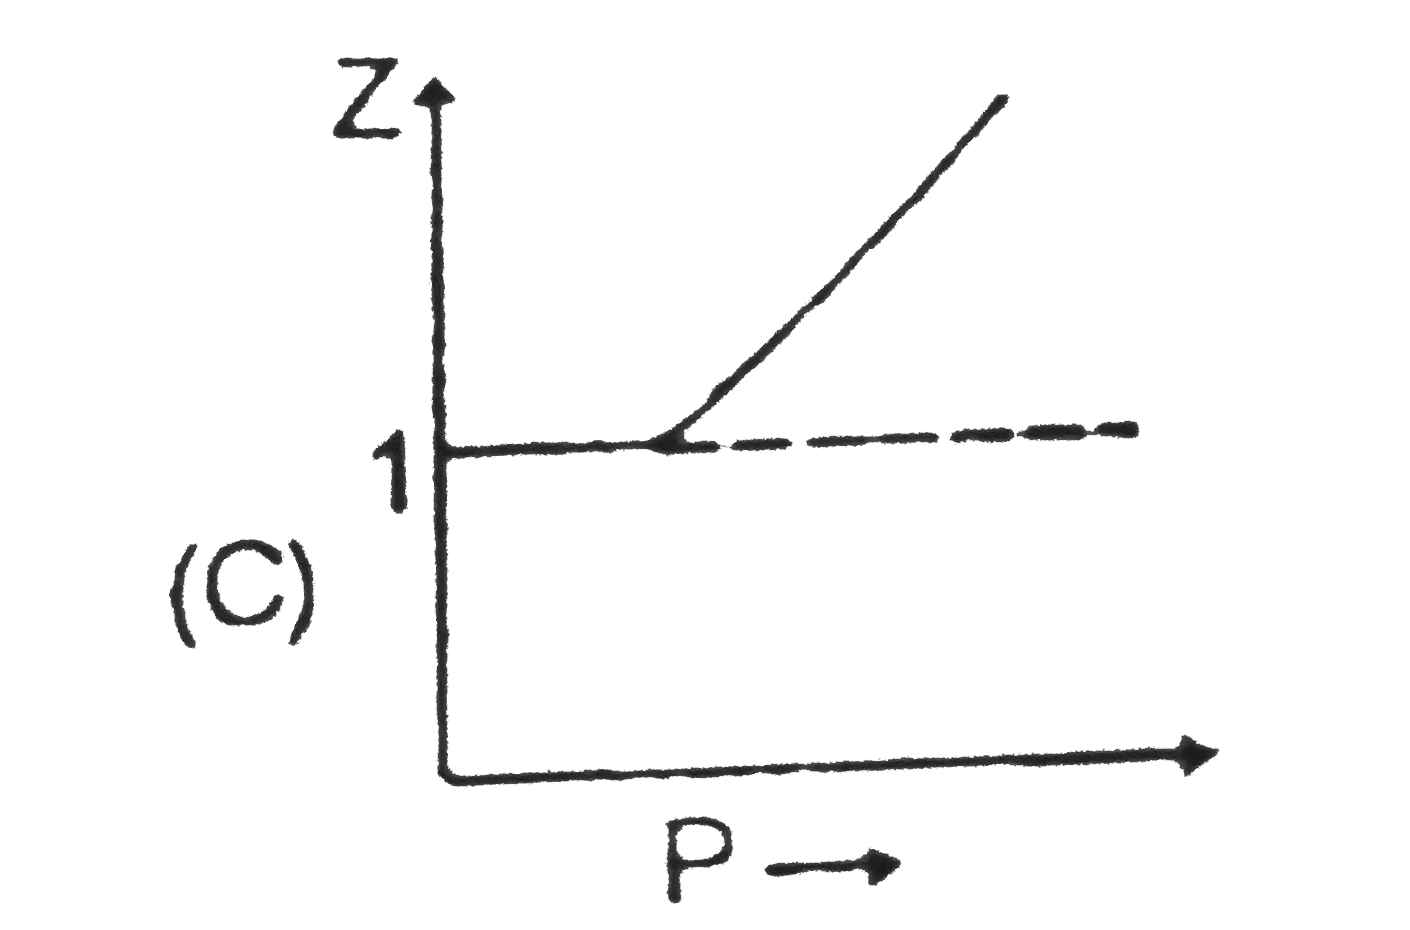
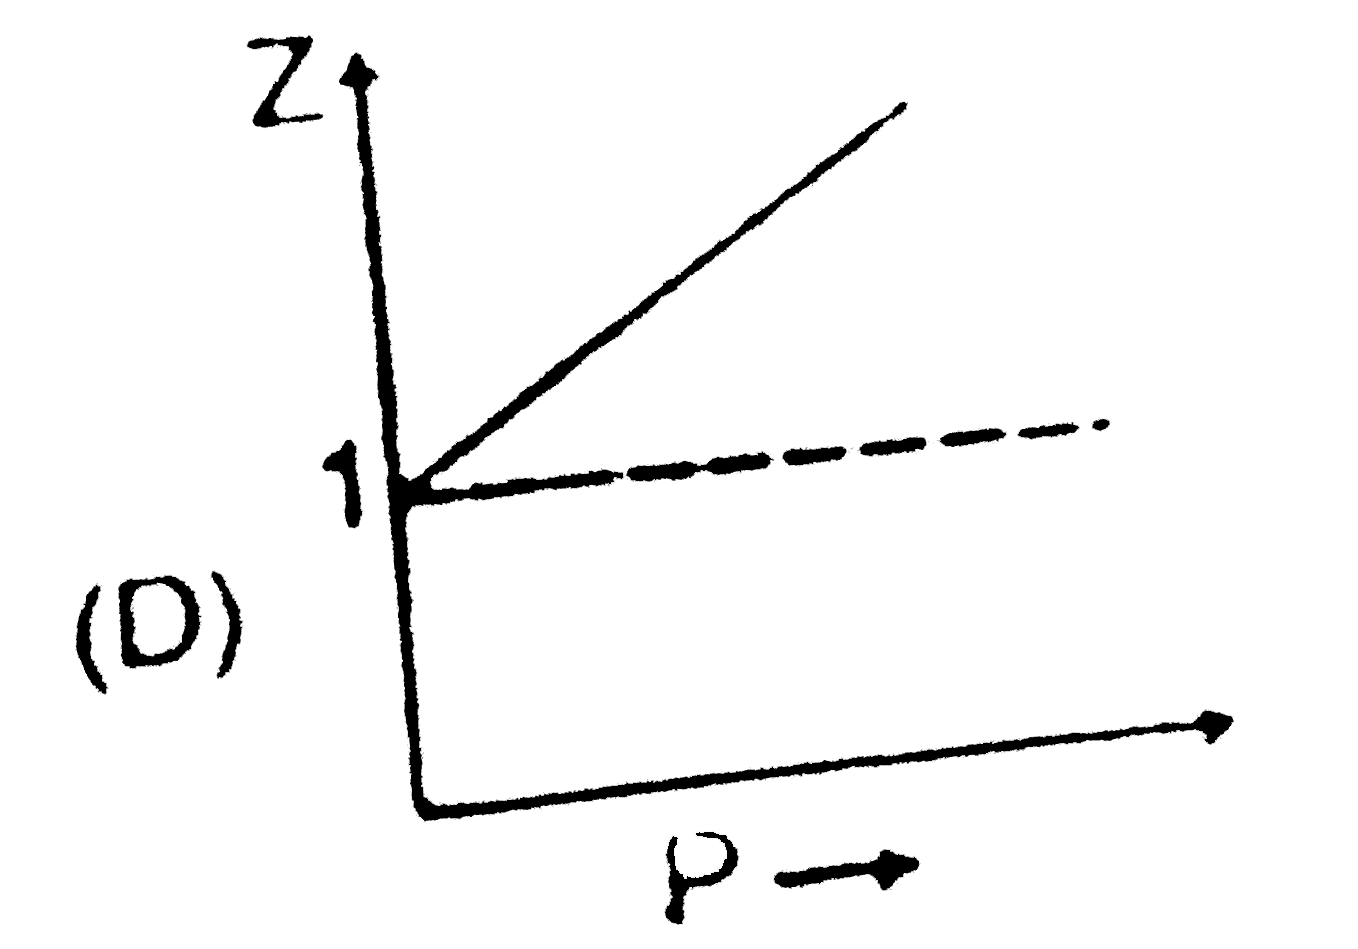
Home
Class 12
CHEMISTRY
At high pressure suppose all the constan...

At high pressure suppose all the constant temperature curve varies linearly with pressure according to the following equation : `Z=1+(Pb)/(RT)` (`R=2 cal "mol"^(-1) K^(-1)`)
Plot at Boyle's temperature for the gas will be

A

B

C

D

Text Solution

AI Generated Solution

The correct Answer is:
To solve the problem, we need to analyze the given equation and understand the implications of Boyle's temperature for a gas. Let's break it down step by step. ### Step 1: Understand the Equation The equation provided is: \[ Z = 1 + \frac{Pb}{RT} \] where: - \( Z \) is the compressibility factor, - \( P \) is the pressure, - \( b \) is a constant specific to the gas, - \( R = 2 \, \text{cal} \, \text{mol}^{-1} \, \text{K}^{-1} \) is the universal gas constant, - \( T \) is the temperature. ### Step 2: Define Boyle's Temperature Boyle's temperature (\( T_B \)) is the temperature at which a real gas behaves ideally. At this temperature, the compressibility factor \( Z \) approaches 1 at high pressures. ### Step 3: Analyze the Equation at Boyle's Temperature At Boyle's temperature, we can set \( T = T_B \): \[ Z = 1 + \frac{Pb}{R T_B} \] At \( P = 0 \) (the ideal gas limit), we have: \[ Z = 1 \] As pressure increases, \( Z \) will increase according to the equation. The relationship indicates that as \( P \) increases, \( Z \) will linearly increase due to the term \( \frac{Pb}{RT} \). ### Step 4: Plotting the Graph To plot the graph of \( Z \) versus \( P \): 1. At \( P = 0 \), \( Z = 1 \). 2. As \( P \) increases, \( Z \) increases linearly based on the equation \( Z = 1 + \frac{Pb}{RT_B} \). The graph will start at the point (0, 1) and will have a slope of \( \frac{b}{RT_B} \). ### Step 5: Conclusion The plot at Boyle's temperature will be a straight line starting from the point (0, 1) and increasing linearly with pressure. ### Final Answer The plot at Boyle's temperature for the gas will be a straight line starting from \( Z = 1 \) at \( P = 0 \) and increasing linearly with pressure. ---

To solve the problem, we need to analyze the given equation and understand the implications of Boyle's temperature for a gas. Let's break it down step by step. ### Step 1: Understand the Equation The equation provided is: \[ Z = 1 + \frac{Pb}{RT} \] where: - \( Z \) is the compressibility factor, - \( P \) is the pressure, ...
Promotional Banner

Topper's Solved these Questions

  • QUALITATIVE ANALYSIS PART 1

    RESONANCE ENGLISH|Exercise A.L.P|39 Videos
  • SOLID STATE

    RESONANCE ENGLISH|Exercise PHYSICAL CHEMITRY (SOLID STATE)|45 Videos

Similar Questions

Explore conceptually related problems

Sketch shows the plot of Z v/s P for a hypothetical gas for one mole at three distint temperature. Boyle's temperature is the temperature at which gas shows ideal behaviour over a pressure range in the low pressure region.Boyle's temperature (T_b)=a/(Rb) .If a plot is obtained at temperature well below Boyle's temperature then the curve will show negative deviation, in low pressure region and positive deviation in the high pressure region. Near critical temperature the curve is more likely as CO_2 and the temperature well above critical temperature curve is more like H_2 at 0^@C as shown above.At high pressure suppose all the constant temperature curve varies linearly with pressure according to the following equation : Z=1+(Pb)/(RT) ( R=2 cal "mol"^(-1) K^(-1) ) Which of the following is correct :

Sketch shows the plot of Z v/s P for a hypothetical gas for one mole at three distint temperature. Boyle's temperature is the temperature at which gas shows ideal behaviour over a pressure range in the low pressure region.Boyle's temperature (T_b)=a/(Rb) .If a plot is obtained at temperature well below Boyle's temperature then the curve will show negative deviation, in low pressure region and positive deviation in the high pressure region. Near critical temperature the curve is more likely as CO_2 and the temperature well above critical temperature curve is more like H_2 at 0^@C as shown above.At high pressure suppose all the constant temperature curve varies linearly with pressure according to the following equation : Z=1+(Pb)/(RT) ( R=2 cal "mol"^(-1) K^(-1) ) For 500 K plot value of Z changes from 2 to 2.2 if pressure is varied from 1000 atm to 1200 atm (high pressure ) then the value of b/(RT) will be

Sketch shows the plot of Z vs P for 1 mol of a hypothetical gas at three distinct temperature. Boyle’s temperature is the temperature at which a gas shows ideal behaviour over a pressure range in the low pressure region. Boyle’s temperature (T_(b)) = (a)/(Rb) . If a plot is obtained at temperatures well below Boyle’s temperature then the curve will show negative deviation, in low pressure region and positive deviation in the high pressure region. Near critical temperature the curve is more like CO_(2) and the temperature well above critical temperature curve is more like H_(2) as shown above. At high pressure suppose all the constant temperature curve varies linearly with pressure according to the following equation: Z =1 + (Pb)/(RT) (R = 2 cal mol^(-1) K^(-1)) For 500 K plot the value of Z changes from 2 to 2.2 if pressure is varied from 1000 atm to 1200 atm (high pressure) then the value of (b)/(RT) will be :

Sketch shows the plot of Z v/s P for a hypothetical gas for one mole at three distint temperature. Boyle's temperature is the temperature at which gas shows ideal behaviour over a pressure range in the low pressure region.Boyle's temperature (T_b)=a/(Rb) .If a plot is obtained at temperature well below Boyle's temperature then the curve will show negative deviation, in low pressure region and positive deviation in the high pressure region. Near critical temperature the curve is more likely as CO_2 and the temperature well above critical temperature curve is more like H_2 at 0^@C as shown above.At high pressure suppose all the constant temperature curve varies linearly with pressure according to the following equation : Z=1+(Pb)/(RT) ( R=2 cal "mol"^(-1) K^(-1) ) In very high pressure region if Z v/s P is plotted at 1200 K for the above gas then it will have greatest slope.

At a constant temperature a gas is initially at 2 atm pressure. To compress it to 1/8th of its initial volume, pressure to be applied is

At constant temperature, the effect of change of pressure on volume of a gas was as given below Plot the following graphs : P vs 1/V

At constant temperature, the effect of change of pressure on volume of a gas was as given below Plot the following graphs : P vs V

The volume of 1 mol of a gas at standard temperature and pressure is .

At constant temperature, the effect of change of pressure on volume of a gas was as given below Plot the following graphs : PV vs P.

The change in the magnitude of the volume of an ideal gas when a small additional pressure DeltaP is applied at a constant temperature, is the same as the change when the temperature is reduced by a small quantity DeltaT at constant pressure. The initial temperature and pressure of the gas were 300 K and 2 atm. respectively. If |DeltaT|=C|DeltaP| then value of C in (K/atm) is __________.

RESONANCE ENGLISH-RANK BOOSTER-All Questions
  1. Sketch shows the plot of Z v/s P for a hypothetical gas for one mole a...

    Text Solution

    |

  2. At 200 K and 500 atm value of compressibility factor is 2.Then volume ...

    Text Solution

    |

  3. At high pressure suppose all the constant temperature curve varies lin...

    Text Solution

    |

  4. Sketch shows the plot of Z v/s P for a hypothetical gas for one mole a...

    Text Solution

    |

  5. Match List : {:("Column-I","Column-II"),((A)PV^(gamma)="Constant",(p...

    Text Solution

    |

  6. The number of moles present in 54.5 g of HSO is

    Text Solution

    |

  7. The number of moles present in 84 g of HSO is

    Text Solution

    |

  8. How many moles are represented by 130 g of glucose,

    Text Solution

    |

  9. How many moles are represented by 150 g of glucose

    Text Solution

    |

  10. How many moles are represented by 120 g of glucose

    Text Solution

    |

  11. Consider the following figure at 500 K.Assuming ideal gas behaviour, c...

    Text Solution

    |

  12. If above tube is placed vertically with the open and upward then find ...

    Text Solution

    |

  13. In a tyre of "Ferrari" car of Mr. Obama, a tube having a volume of 12....

    Text Solution

    |

  14. 2 moles of Ne gas and 5 moles of He gas, both samples having average v...

    Text Solution

    |

  15. Two glass bulbs of equal volume are connected by a narrow tube and are...

    Text Solution

    |

  16. According to Maxwell's distribution of molecular speeds, the following...

    Text Solution

    |

  17. A bulb of constant volume is attached to a manometer tube open at othe...

    Text Solution

    |

  18. The pressure exerted by 12 g of an ideal gas at temperature T^(@)C in...

    Text Solution

    |

  19. A 4: 1 molar mixture of He and CH4 is contained in a vessel at 20 bar ...

    Text Solution

    |

  20. What mass of potassium chlorate (KClO3) on heating gives 1.691 g of po...

    Text Solution

    |