A
B
C
D
Text Solution
Verified by Experts
The correct Answer is:


Topper's Solved these Questions
CHEMICAL EQUILIBRIUM
RESONANCE ENGLISH|Exercise Advanced Level Problems (Part-2)(Section-2)|6 VideosCHEMICAL EQUILIBRIUM
RESONANCE ENGLISH|Exercise Advanced Level Problems (Part-2)(Section-3)|6 VideosCHEMICAL EQUILIBRIUM
RESONANCE ENGLISH|Exercise Advanced Level Problems (Part-1)|31 VideosCHEMICAL BONDING
RESONANCE ENGLISH|Exercise ORGANIC CHEMISTRY(Fundamental Concept )|6 VideosD & F-BLOCK ELEMENTS & THEIR IMPORTANT COMPOUNDS
RESONANCE ENGLISH|Exercise Match the column|1 Videos
Similar Questions
Explore conceptually related problems
RESONANCE ENGLISH-CHEMICAL EQUILIBRIUM-Advanced Level Problems (Part-2)(Section-1)
- Write the equilibrium constant of the reaction C(s)+H(2)O(g)hArrCO(...
Text Solution
|
- For the reaction PCl(5)hArrPCl(3)+Cl(2), Supposing at constant tempera...
Text Solution
|
- A vessel of 10L was filled with 6 mole of Sb(2)S(3) and 6 mole of H(2)...
Text Solution
|
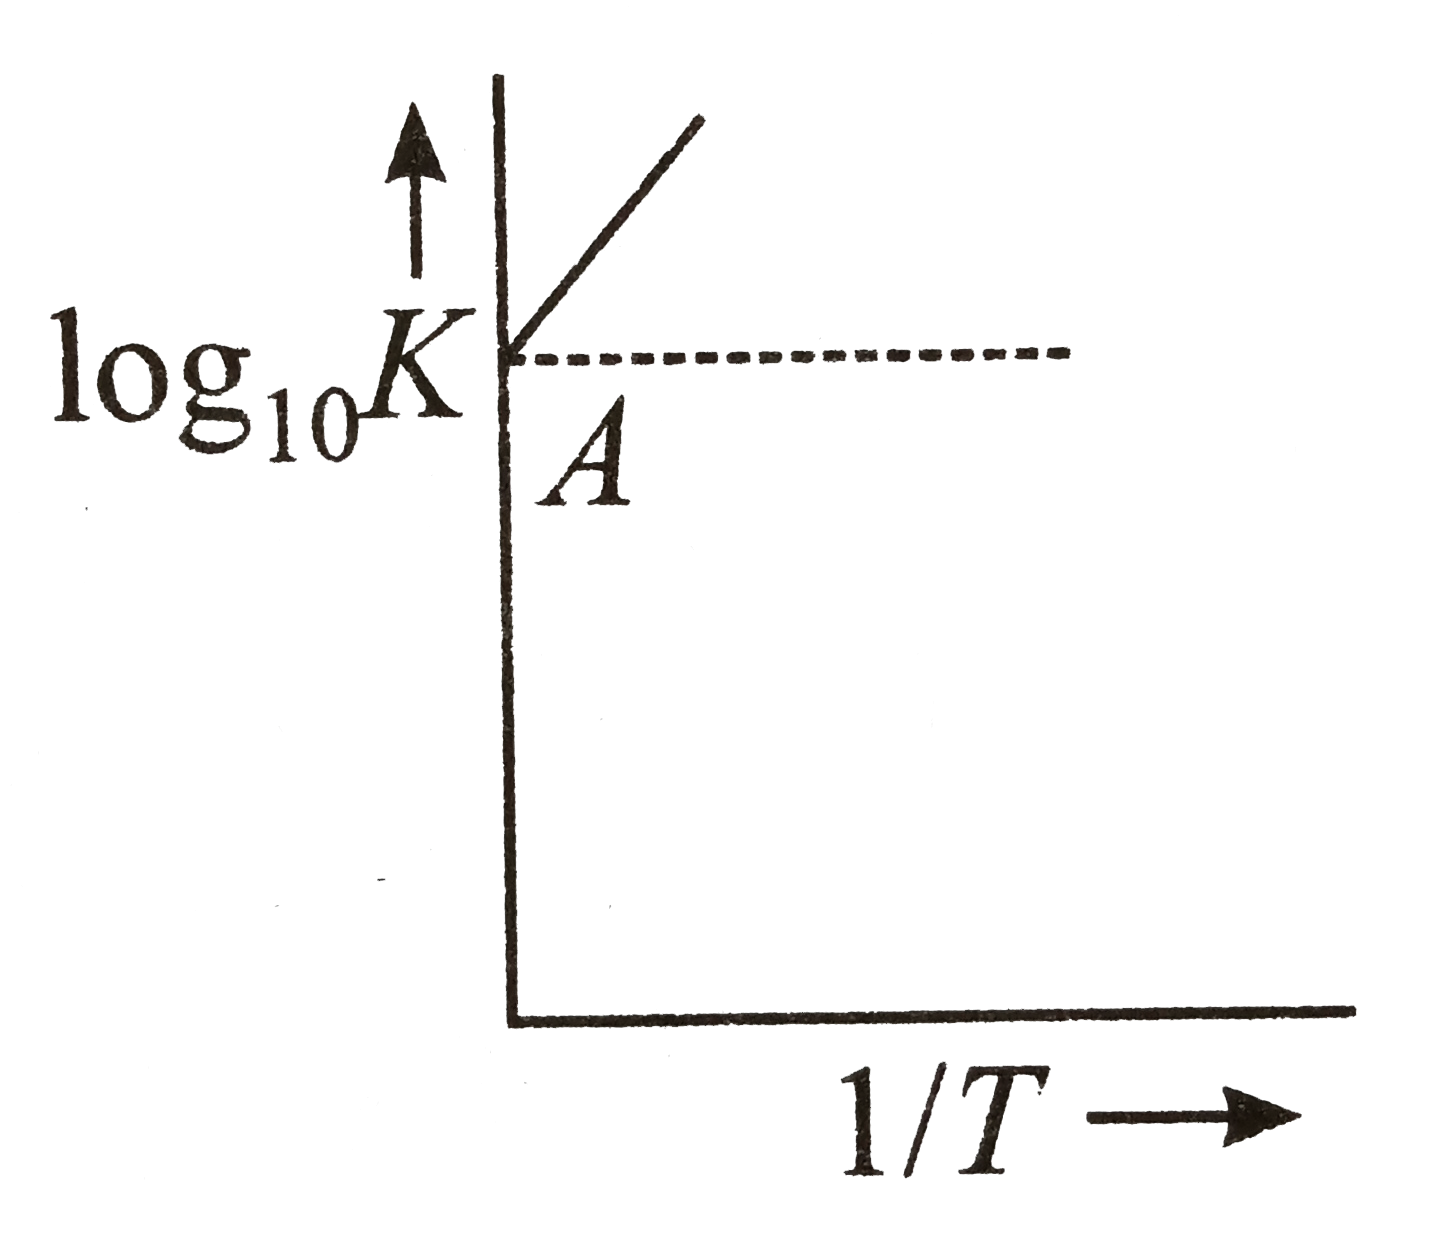
- Variation of log(10)K with (1)/(T) is shown by the following graph in ...
Text Solution
|
- aA+bBhArrcC+dD In above reaction low pressure and high temperature, ...
Text Solution
|
- The value of K(p) for the reaction at 27^(@)C Br(2)(l)+CI(2)(g)hArr2...
Text Solution
|
- C(s)hArr2A(g)+B(s) If the dissociation of C(s) is alpha and d is the...
Text Solution
|