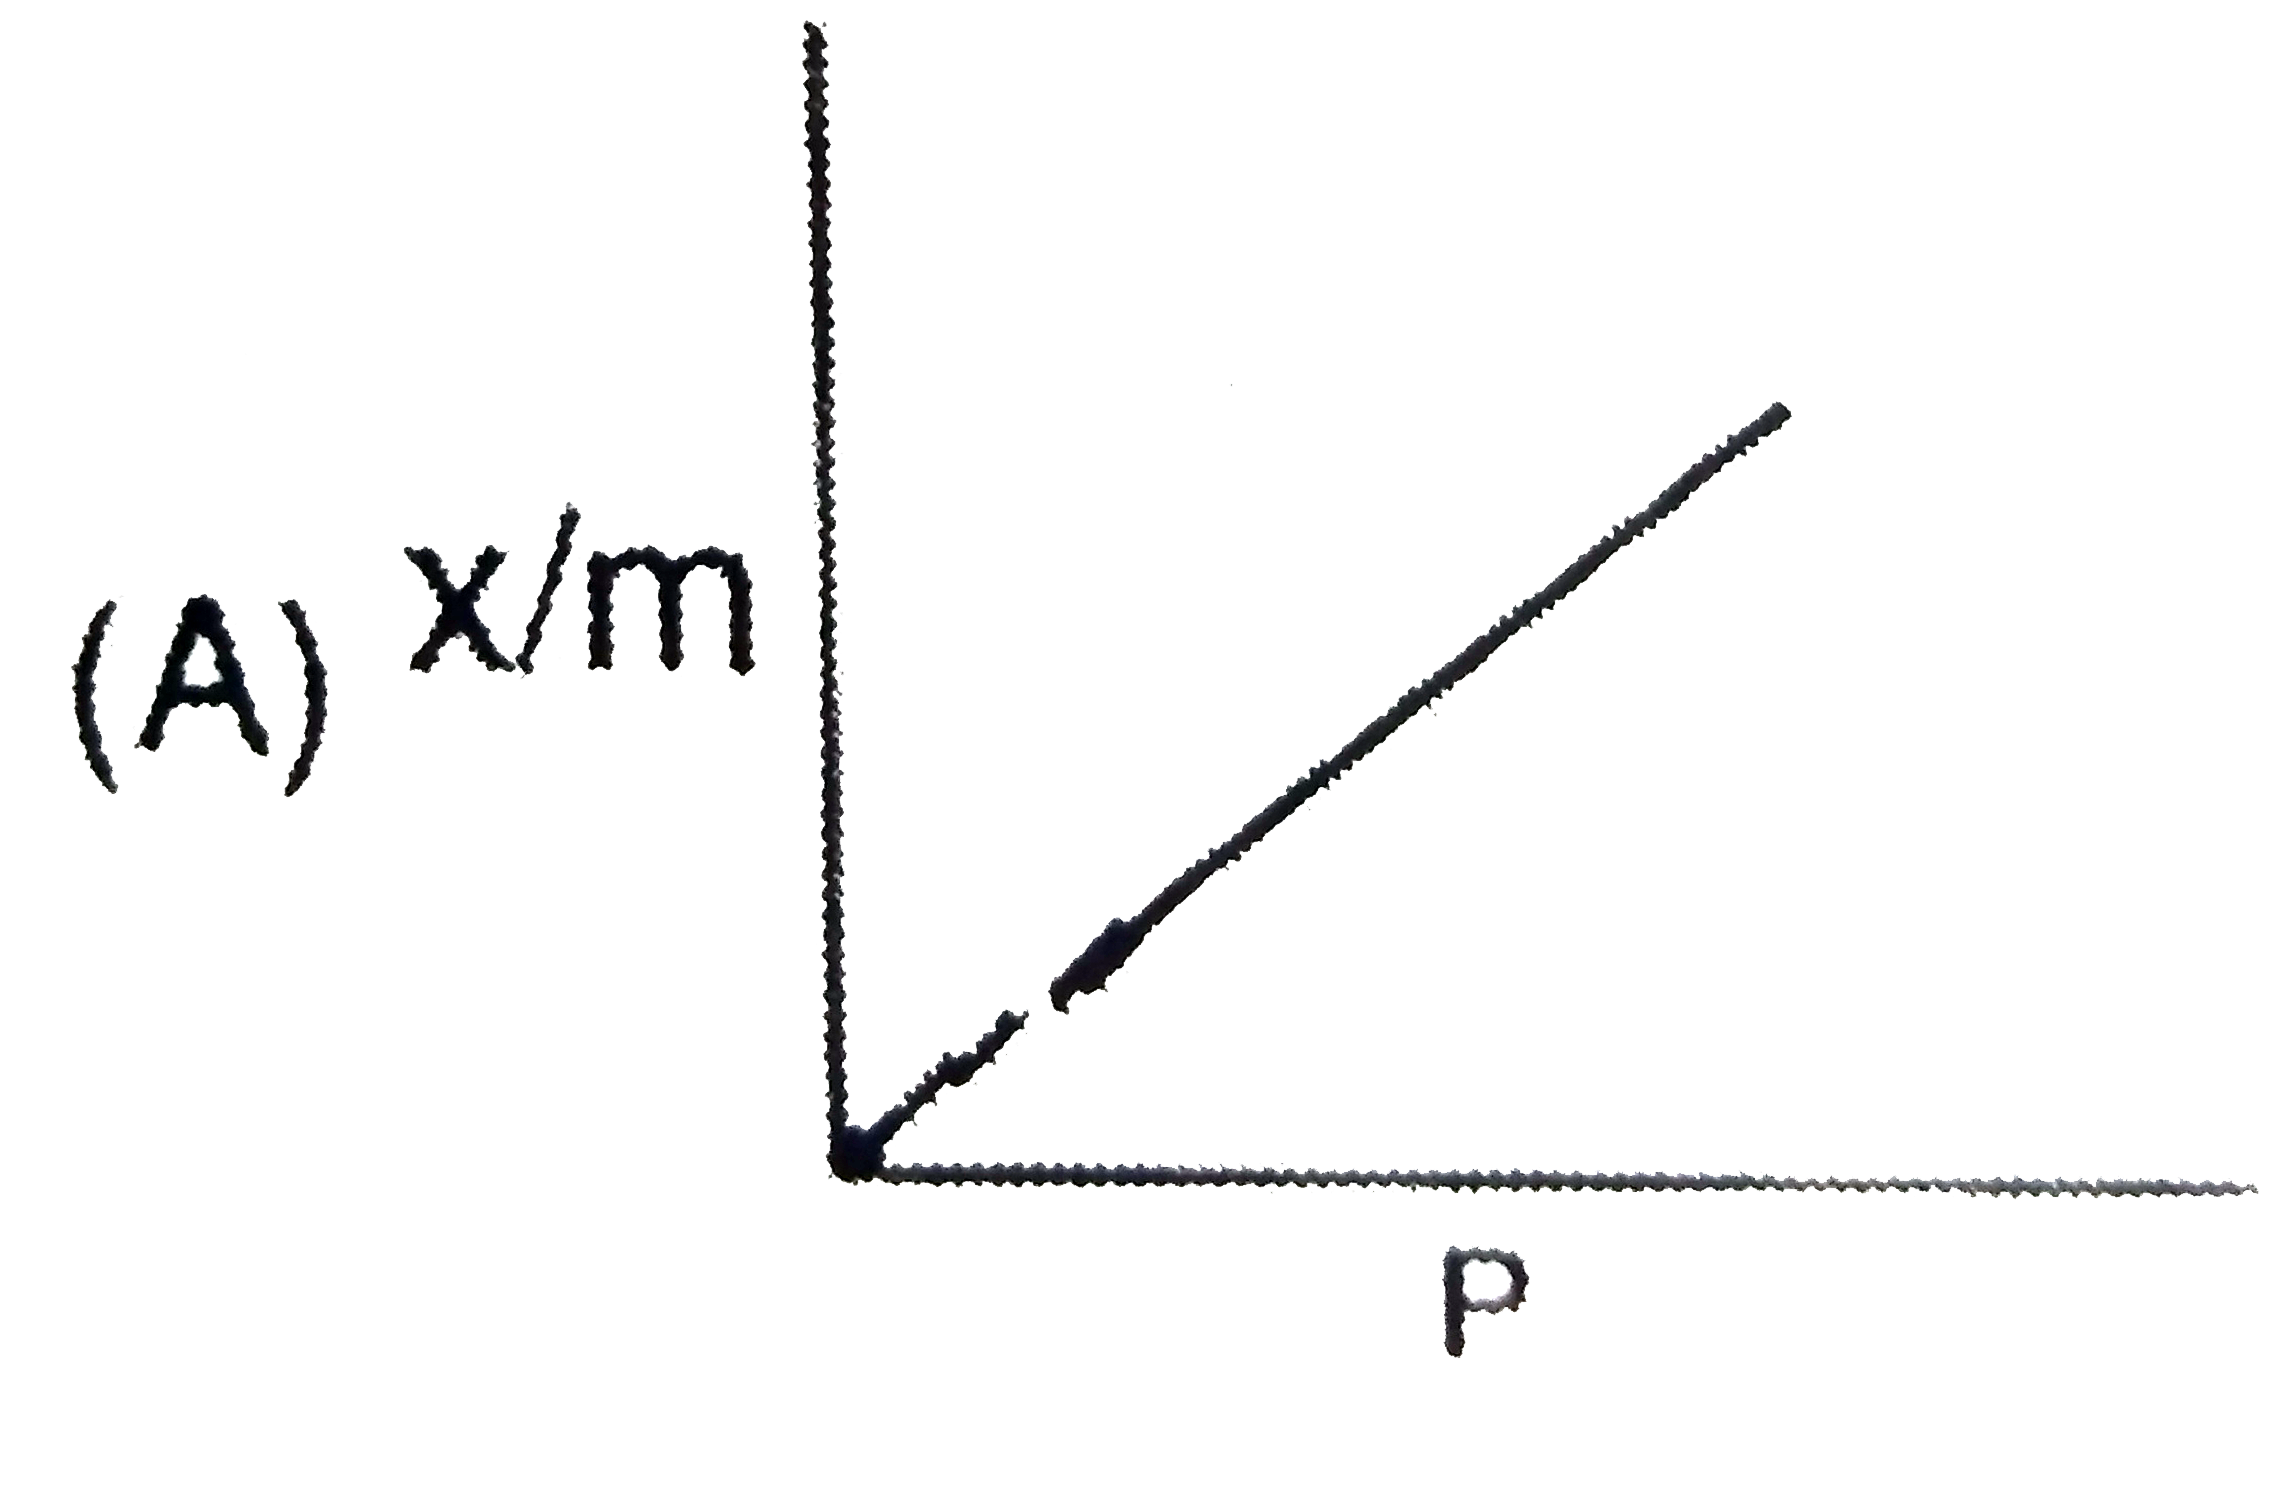
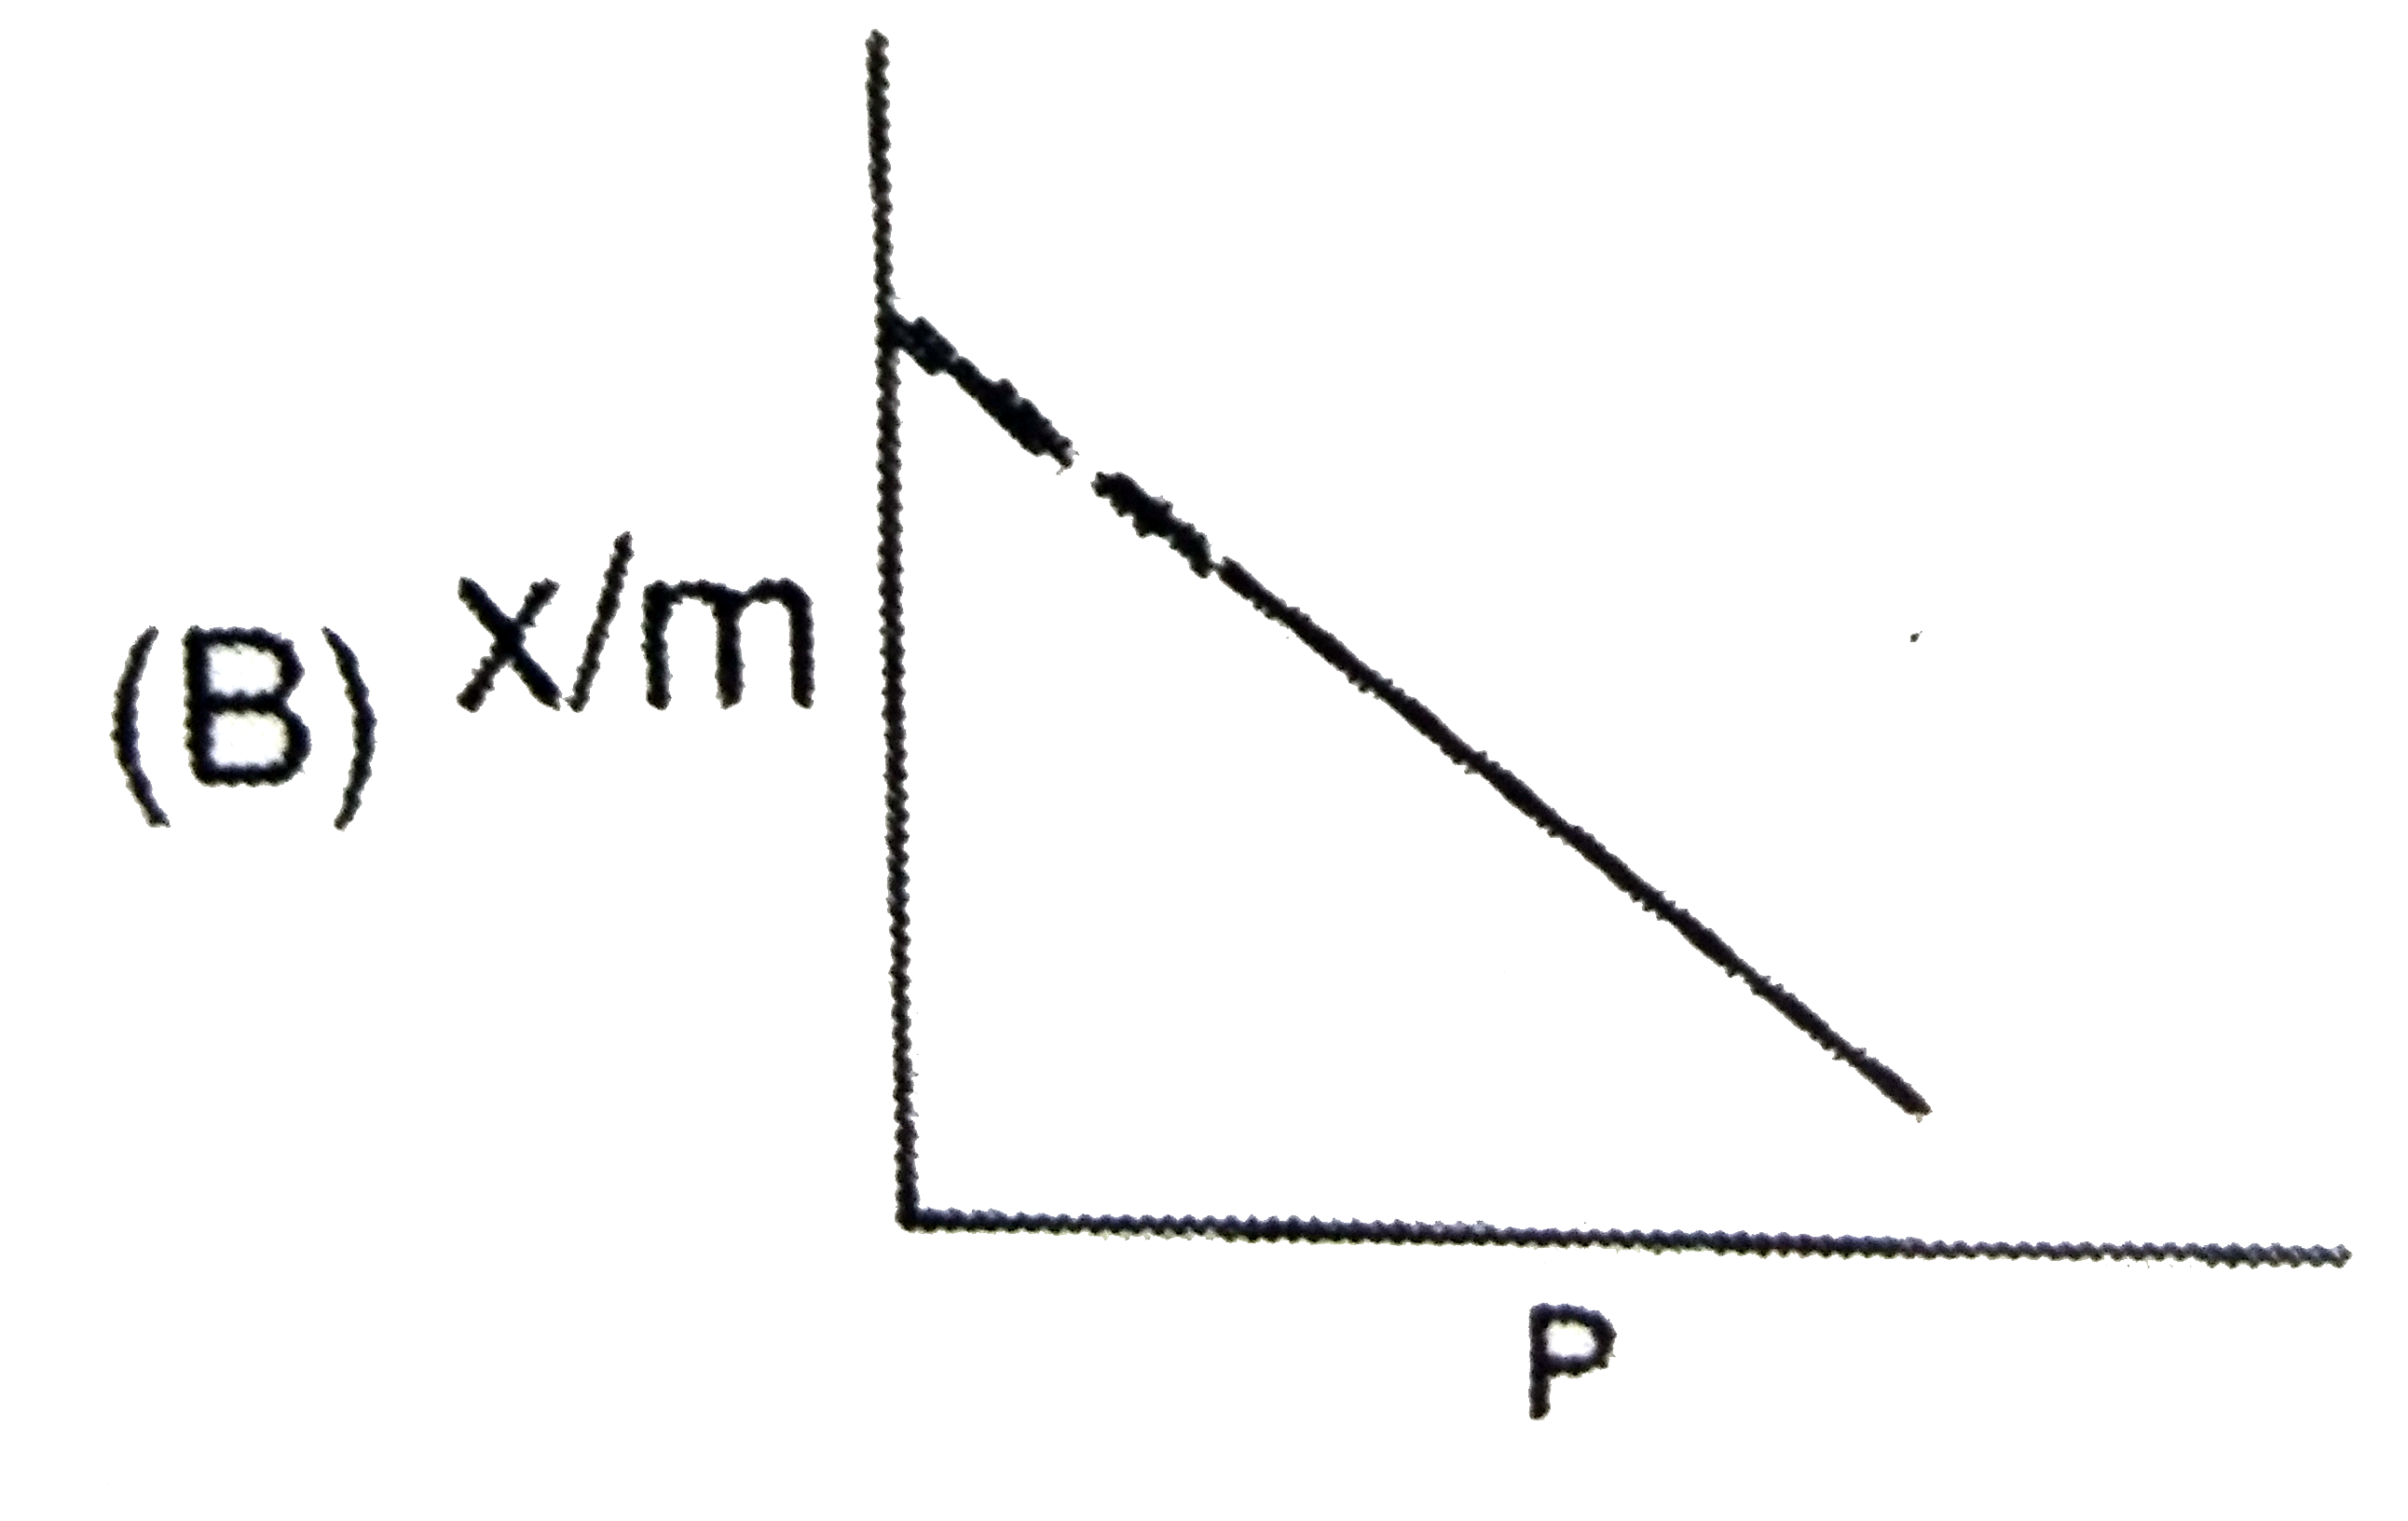
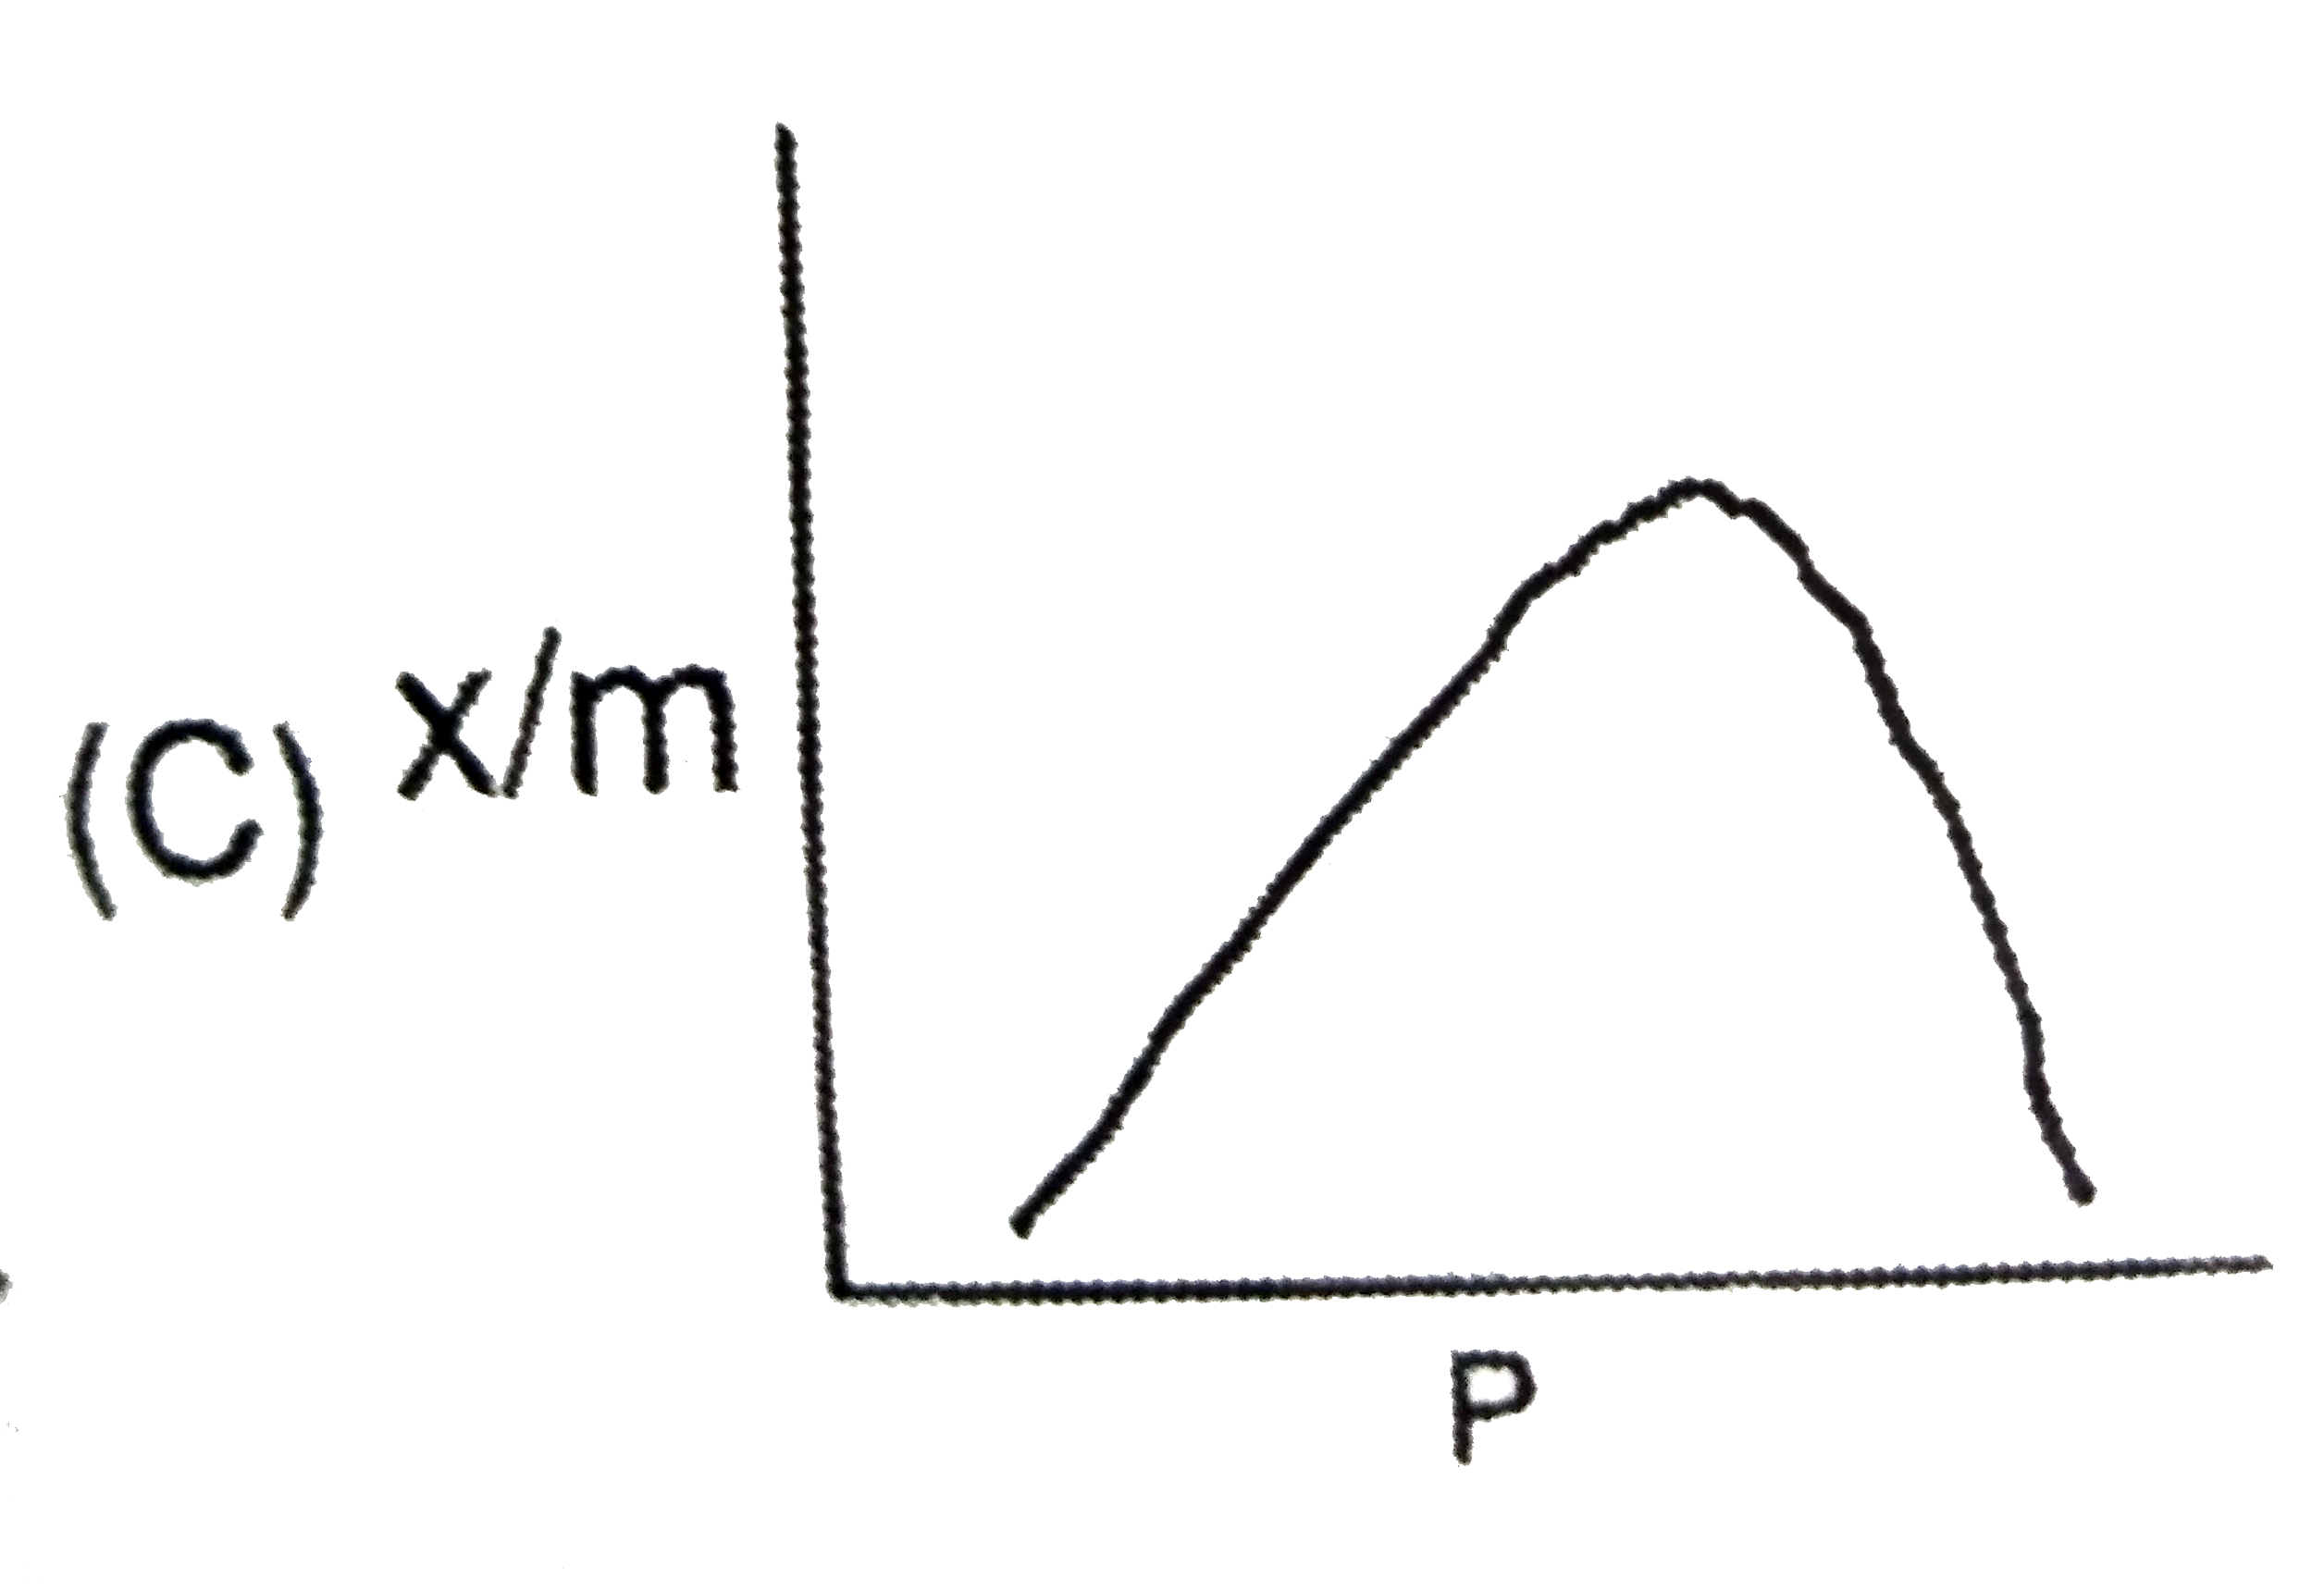
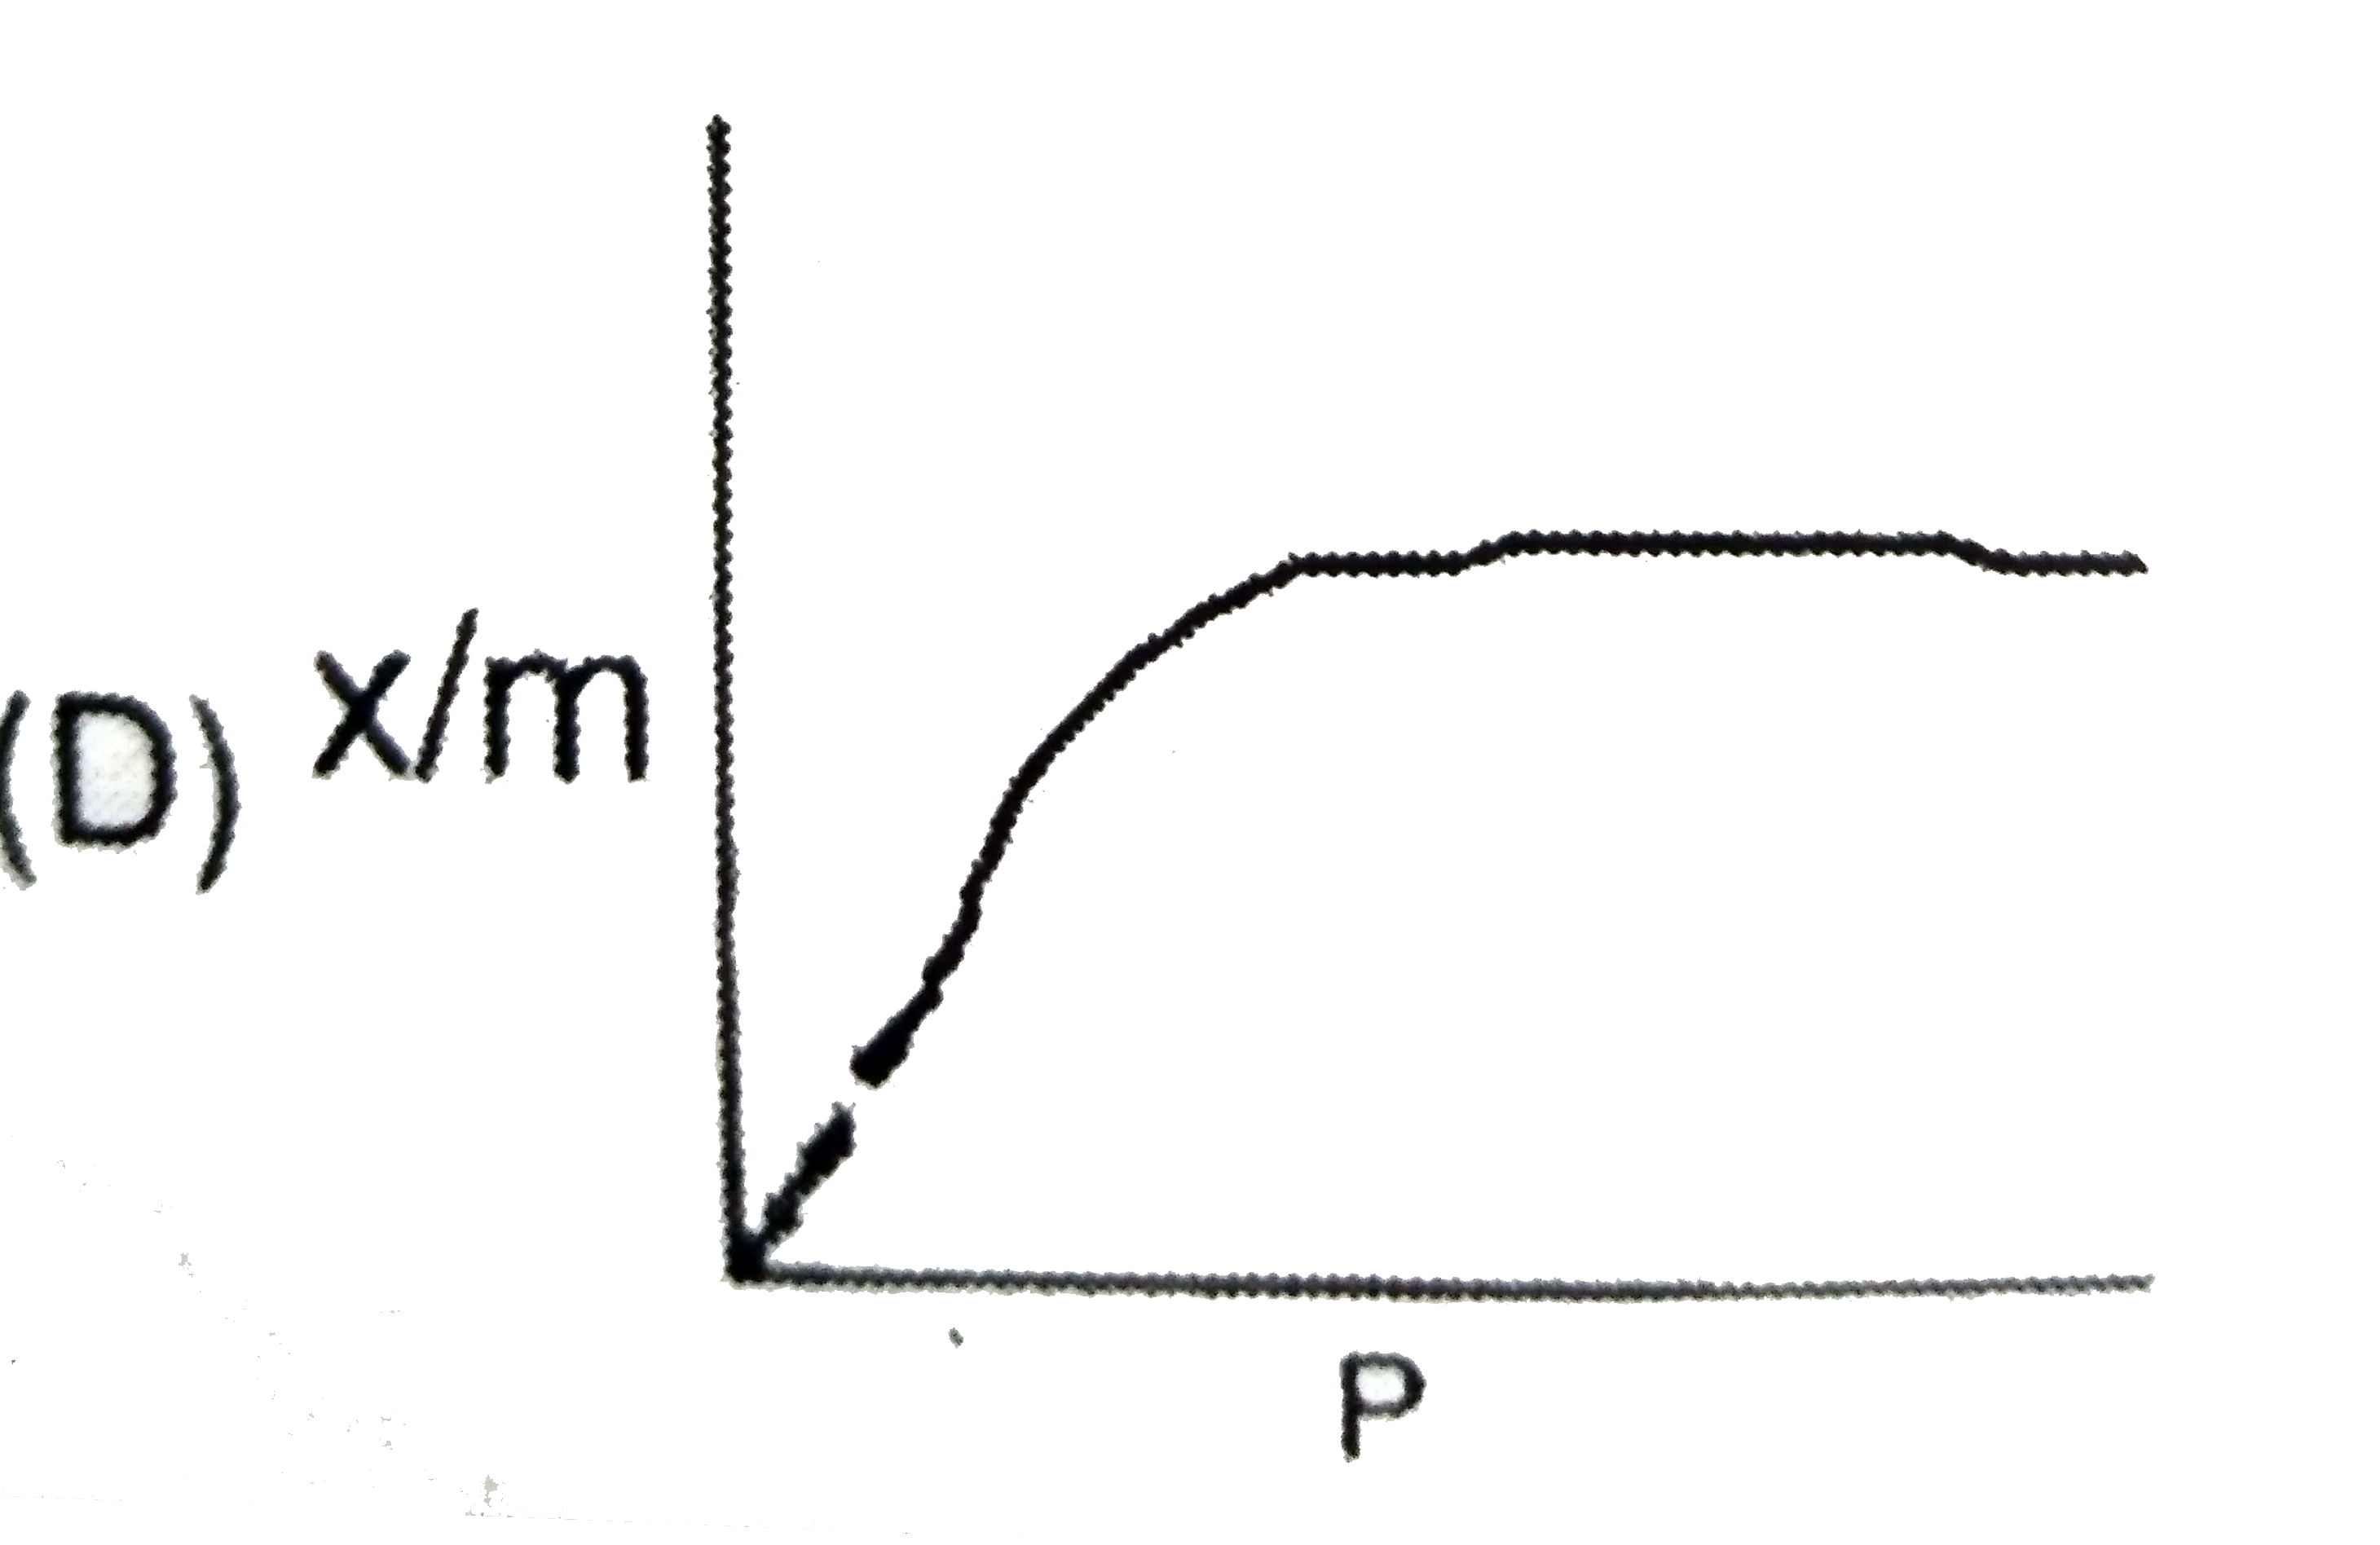
Home
Class 12
CHEMISTRY
The mass of argon adsorbed per unit mass...

The mass of argon adsorbed per unit mass of carbon surface is plotted against pressure. Which of the following plots is correct if x and m represent the masses of argon and carbon respectively ? (………. Represents extrapolated data)

A

B

C

D

Text Solution

AI Generated Solution

The correct Answer is:
To solve the problem of determining the correct plot for the mass of argon adsorbed per unit mass of carbon surface against pressure, we can follow these steps: ### Step 1: Understand the Concept of Adsorption Adsorption is the process by which atoms, ions, or molecules from a gas, liquid, or dissolved solid adhere to a surface. In this case, argon is the adsorbate and carbon is the adsorbent. ### Step 2: Apply the Freundlich Adsorption Isotherm The Freundlich adsorption isotherm describes how the amount of adsorbate on the adsorbent varies with pressure. The relationship can be expressed as: \[ \frac{x}{m} = k \cdot p^{\frac{1}{n}} \] where: - \( \frac{x}{m} \) is the mass of argon adsorbed per unit mass of carbon, - \( p \) is the pressure, - \( k \) is a constant, - \( n \) is a constant that typically lies between 0 and 1. ### Step 3: Analyze the Equation From the equation, we can see that as pressure \( p \) increases, \( \frac{x}{m} \) also increases. However, the rate of increase will diminish as \( p \) continues to rise because of the exponent \( \frac{1}{n} \) (where \( n > 1 \) implies a decreasing rate of adsorption). ### Step 4: Graphical Representation When plotting \( \frac{x}{m} \) against pressure \( p \): - Initially, as pressure increases, \( \frac{x}{m} \) will increase rapidly. - After a certain point, the increase will slow down and approach a plateau, indicating that the surface is becoming saturated with adsorbate. ### Step 5: Identify the Correct Plot The correct plot will show an initial steep increase followed by a gradual leveling off. This behavior is characteristic of the Freundlich isotherm. ### Conclusion The correct option that represents this kind of graph is option 4, which shows the expected behavior of the adsorption process according to the Freundlich adsorption isotherm. ---
Promotional Banner

Topper's Solved these Questions

  • SURFACE CHEMISTRY

    RESONANCE ENGLISH|Exercise Part - III : High Level Problems|2 Videos
  • SURFACE CHEMISTRY

    RESONANCE ENGLISH|Exercise Only One Option Correct Type|7 Videos
  • SURFACE CHEMISTRY

    RESONANCE ENGLISH|Exercise Part - I Practice Test - 1 (IIT - JEE (Main Pattern))|29 Videos
  • STRUCTURAL IDENTIFICATION

    RESONANCE ENGLISH|Exercise Advanced level Problems (Part-III)|12 Videos
  • TEST PAPERS

    RESONANCE ENGLISH|Exercise FST-3|30 Videos

Similar Questions

Explore conceptually related problems

For a fixed mass of gas and constant pressure, which of the following graphs is / are correct?

Which of the following series of compounds have same mass percentage of carbon ?

A block of mass m is at rest under the action of force F against a wall as shown in figure. Which of the following statement is incorrect?

If x/m is the mass of adsorbate adsorbed per unit mass of adsorbent, P is the pressure of the adsorbate gas ,a and b are constant ,which of the following represent "Langmuir adsorption isotherm"?

The masses of carbon, hydrogen and oxygen in ann organic compound are in the ratio 6:1:8 respectively. Which of the following pairs of formulae correspond to above information?

A fixed mass of an ideal gas undergoes changes of pressure and volume starting at L , as shown in Figure. Which of the the following is correct:

A piece of cork starts from rest at the bottom of a lake and floats up. Its velocity v is plotted against time t. Which of the following best represents the resulting curve?

A piece of cork starts from rest at the bottom of a lake and floats up. Its velocity v is plotted against time t. Which of the following best represents the resulting curve?

The following graph represents variation of boiling point with composition of liquid and vapours of binary liquid mixture. The graph is plotted at constant pressure. Which of the following statement(s) is incorrect. Here X & Y stands for mole fraction in liquid and vapour phase respectively.

Compressibility factor (Z) is plotted against pressure at different temperature for same gas Which of the following is the correct order of temperature shown in the above plot ?

RESONANCE ENGLISH-SURFACE CHEMISTRY-Part - II : National Standard Examination in Chemistry Stage - 1
  1. Soaps essentially form a colloidal solution in water and remove the gr...

    Text Solution

    |

  2. Swimming for a long time in salt water makes the skin of one's finger ...

    Text Solution

    |

  3. Tyndall effect in colloidal solution is due to .

    Text Solution

    |

  4. Ferric chloride is applied to stop bleeding because:

    Text Solution

    |

  5. A catalyst is a substance which :

    Text Solution

    |

  6. In nature, ammonia is synthesisd by nitrifying bacteria using enzymes ...

    Text Solution

    |

  7. A catalyst increases the

    Text Solution

    |

  8. Soaps essentially form a colloidal solution in water and remove the gr...

    Text Solution

    |

  9. Smoke is an example of

    Text Solution

    |

  10. A catalyst speeds up a chemical reraction by

    Text Solution

    |

  11. The plot representing Langmuir's adsorption isotherm is :

    Text Solution

    |

  12. Frendlich adsorption isotherms are properly represented as in

    Text Solution

    |

  13. A gold sol is prepared by :

    Text Solution

    |

  14. Effective electrolyte to cause the flocculation of a negatively charge...

    Text Solution

    |

  15. A catalyst is a substance which :

    Text Solution

    |

  16. Which of the following reaction parameters will change due to addition...

    Text Solution

    |

  17. In electrophoresis,

    Text Solution

    |

  18. 100 mL of 0.3 M acetic acid is shaken with 0.8 g wood charcoal. The fi...

    Text Solution

    |

  19. The mass of argon adsorbed per unit mass of carbon surface is plotted ...

    Text Solution

    |

  20. The equation of state of some gases can be expressed as (p+(a)/(V^(2...

    Text Solution

    |