


Topper's Solved these Questions
QUESTION BANK 2021
NAVNEET PUBLICATION - MAHARASHTRA BOARD|Exercise Part II 4. TIME SERIES (V) Activity based questions)|4 VideosQUESTION BANK 2021
NAVNEET PUBLICATION - MAHARASHTRA BOARD|Exercise Part II 5. INDEX NUMBERS (I) Choose the correct alternative.)|9 VideosQUESTION BANK 2021
NAVNEET PUBLICATION - MAHARASHTRA BOARD|Exercise Part II 4. TIME SERIES (III) State whether each of the following is True or False.)|5 VideosPROBABILITY DISTRIBUTION
NAVNEET PUBLICATION - MAHARASHTRA BOARD|Exercise MULTIPLE CHOICE QUESTIONS|9 VideosTHREE DIMENSIONAL GEOMETRY
NAVNEET PUBLICATION - MAHARASHTRA BOARD|Exercise MULTIPLE CHOICE QUESTIONS|8 Videos
Similar Questions
Explore conceptually related problems
NAVNEET PUBLICATION - MAHARASHTRA BOARD-QUESTION BANK 2021-Part II 4. TIME SERIES (IV) Solve the following problems.)
- Following table shows the amount of sugar production (in lac tons) for...
Text Solution
|
- Obtain trend values for data in Problem 1 using 4-yearly centered movi...
Text Solution
|
- The following table gives the production of steel (in millions of tons...
Text Solution
|
- Obtain the eighth term in the series 2, 6, 18, 54,.........
Text Solution
|
- Use the method of least squares to fit a trend line to the data in Pro...
Text Solution
|
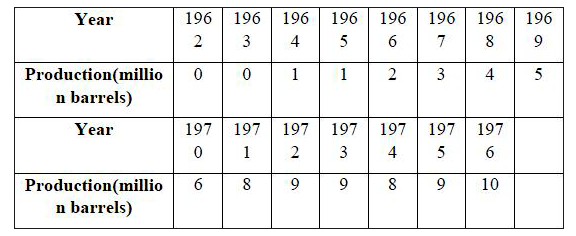
- The following table shows the production of gasoline in U.S.A. for the...
Text Solution
|