


Similar Questions
Explore conceptually related problems
Recommended Questions
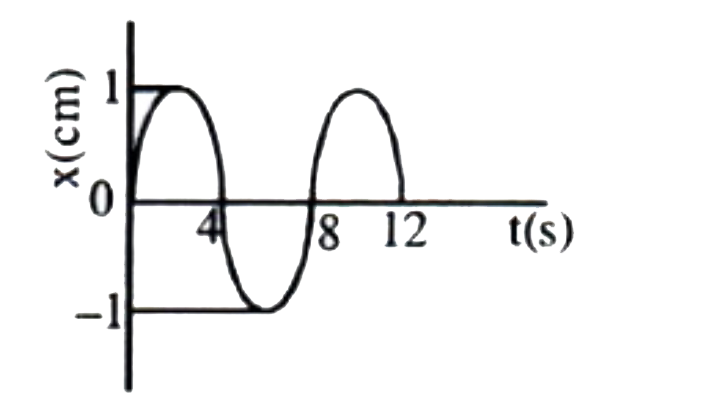
- The x-t graph of a particle undergoing simple harmonic motion is shown...
Text Solution
|
- The acceleration displacement graph of a particle executing simple har...
Text Solution
|
- The x-t graph of a particle undergoing simple harmonic motion is shown...
Text Solution
|
- The x-t graph of a particle undergoing simple harmonic motion is shown...
Text Solution
|
- The x-t graph of a particle undergoing simple harmonic motion is shown...
Text Solution
|
- The x - t graph of a particle undergoing simple harmonic motion is sho...
Text Solution
|
- The x-t graph of a particle undergoing simple harmonic motion is shown...
Text Solution
|
- The displacement vs time graph of a particle undergoing S.H>M. Is show...
Text Solution
|
- The x-t graph of a particle undergoing SHM is as shown in figure. The ...
Text Solution
|