Home
Class 12
CHEMISTRY
Which of the graphs shown below does not...

Which of the graphs shown below does not represent the relationship between incident light and the electron ejected from metal surface?

A

B

C

D

Text Solution

AI Generated Solution

The correct Answer is:
To solve the question about which graph does not represent the relationship between incident light and the electrons ejected from a metal surface, we need to analyze the principles of the photoelectric effect and the relationships involved. ### Step-by-Step Solution: 1. **Understanding the Photoelectric Effect**: - According to Einstein's photoelectric equation, the energy of the incident photon (light) is given by \( E = h\nu \), where \( h \) is Planck's constant and \( \nu \) is the frequency of the light. - The equation can be expressed as: \[ h\nu = h\nu_0 + \frac{1}{2}mv^2 \] where \( \nu_0 \) is the threshold frequency, \( m \) is the mass of the electron, and \( v \) is its velocity. 2. **Analyzing the Graphs**: - **Graph A**: Represents the kinetic energy of the ejected electrons as a function of the frequency of the incident light. This is correct as per the photoelectric effect; kinetic energy increases with frequency above the threshold frequency. - **Graph B**: Indicates that the kinetic energy of electrons is directly proportional to the energy of the light. This is also correct since energy is proportional to frequency. - **Graph C**: Suggests that the number of electrons ejected per second depends on the intensity of light but is independent of frequency. This is true; however, the graph may incorrectly imply a relationship that doesn't exist. - **Graph D**: Shows that the kinetic energy of electrons remains constant with changes in intensity. This is incorrect because the kinetic energy of ejected electrons depends on the frequency of the incident light, not its intensity. 3. **Conclusion**: - The graph that does not correctly represent the relationship between incident light and the ejected electrons is **Graph D**. This is because it incorrectly suggests that the kinetic energy of the electrons is constant regardless of changes in intensity, which contradicts the principles of the photoelectric effect. ### Final Answer: **Graph D does not represent the relationship between incident light and the electrons ejected from a metal surface.**

To solve the question about which graph does not represent the relationship between incident light and the electrons ejected from a metal surface, we need to analyze the principles of the photoelectric effect and the relationships involved. ### Step-by-Step Solution: 1. **Understanding the Photoelectric Effect**: - According to Einstein's photoelectric equation, the energy of the incident photon (light) is given by \( E = h\nu \), where \( h \) is Planck's constant and \( \nu \) is the frequency of the light. - The equation can be expressed as: \[ ...
Promotional Banner

Topper's Solved these Questions

  • JEE MAIN REVISION TEST - 18

    VMC MODULES ENGLISH|Exercise CHEMISTRY - SECTION 2|5 Videos
  • JEE MAIN REVISION TEST - 22 JEE - 2020

    VMC MODULES ENGLISH|Exercise CHEMISTRY|25 Videos

Similar Questions

Explore conceptually related problems

Relationship between incident light and CO_2 fixation rate is

Which graph best represent the relationship between conductivity and resistivity for a solid ?

Linear relationship exists between incident light and rate of CO_(2) fixation at/in.

If lamda_o and lamda be the threshold wavelength and wavelength of incident light , the velocity of photoelectron ejected from the metal surface is :

Which of the following graphs represents the relationship between the force F between two point charges and the distance r between them :

The graph shown represents which of the following equations ?

Which of the following equations represents the line shown in the graph?

Assertion : The number of electrons ejected from a metal surface depend upon the frequency of light. Reason : There is a time lag between the striking of light beam and the ejection of electrons from the metal surface.

A metal surface in an evacuated tube is illuminated with monochromatic light causing the emission of photoelectrons. For a given intensity of light, a graph between saturation current and potential of the electrode is given in Fig. If the experiment were repeated with light of twice the intensity but the same wavelength, which of the graphs below would best represent the new relation between I and V?(Dotted represents initial condition)

Which one of the following function best represents the graphs as shown below?

VMC MODULES ENGLISH-JEE MAIN REVISION TEST - 19-CHEMISTRY
  1. Which dicarboxylic acid in presence of a dehydrating agent is least re...

    Text Solution

    |

  2. The total number of isotopes of hydrogen and number of radioactive iso...

    Text Solution

    |

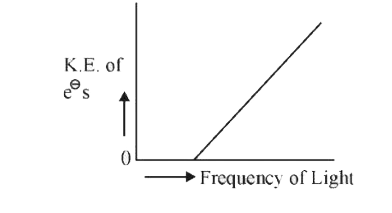
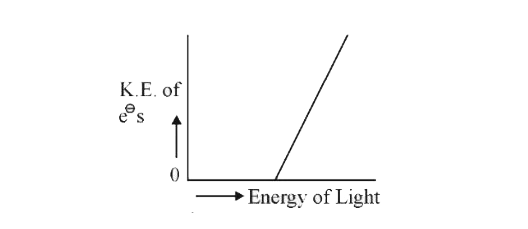
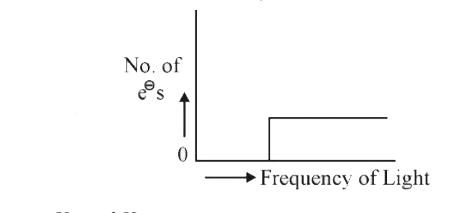
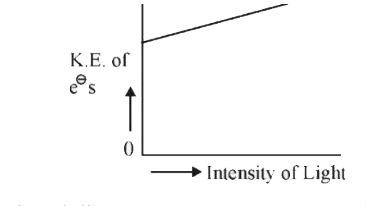
  3. Which of the graphs shown below does not represent the relationship be...

    Text Solution

    |

  4. K(1) and K(2) are equilibrium constants for reaction (i) and (ii) N(...

    Text Solution

    |

  5. Ziegler-Natta catalyst is

    Text Solution

    |

  6. Two pi and half sigma bonds are present in :

    Text Solution

    |

  7. The decreasing order of ease of alkaline hydrolysis for the following ...

    Text Solution

    |

  8. The effect of lanthanoid contraction in the lanthanoid series of eleme...

    Text Solution

    |

  9. Which of the following is an example of homogeneous catalytic reaction...

    Text Solution

    |

  10. The major product of the following reaction is :

    Text Solution

    |

  11. The type of hybridisation and number of lone pair(s) of electrons of X...

    Text Solution

    |

  12. Castner kellner process is given by:

    Text Solution

    |

  13. The major product formed in the reaction given below will be:

    Text Solution

    |

  14. Consider the following reduction processes : Zn^(2+)+2e^(-)toZn(s), ...

    Text Solution

    |

  15. The reducing power of the metal decreases in the order:

    Text Solution

    |

  16. Liquids A and B form an ideal solution in the entire composition range...

    Text Solution

    |

  17. A process has Delta H = 8 K J mol^(-1) " and " Delta S = 80JK^(-1) mo...

    Text Solution

    |

  18. The total number of isomers for a square planer complex [M(F)(Cl)(SCN)...

    Text Solution

    |

  19. Solution of CH3 COOH [Ka = 10^(-5) " at " 25^@ ] is been neutraliz...

    Text Solution

    |

  20. Number of peroxide bonds in the compound Cr2 O(9)^(2-) .

    Text Solution

    |