A
B
C
D
Text Solution
Verified by Experts
The correct Answer is:


Topper's Solved these Questions
GASEOUS STATE & THERMODYNAMICS
VMC MODULES ENGLISH|Exercise Level - 2|40 VideosGASEOUS STATE & THERMODYNAMICS
VMC MODULES ENGLISH|Exercise JEE MAIN (ARCHIVE )|81 VideosGASEOUS STATE & THERMODYNAMICS
VMC MODULES ENGLISH|Exercise level-0 Short Answer Type – II|24 VideosENERGY & MOMENTUM
VMC MODULES ENGLISH|Exercise JEE ADVANCE (ARCHIVE) - TRUE/FALSE TYPE|1 VideosGRAVITATION
VMC MODULES ENGLISH|Exercise JEE Advance (Archive) TRUE/FALSE|1 Videos
Similar Questions
Explore conceptually related problems
VMC MODULES ENGLISH-GASEOUS STATE & THERMODYNAMICS-Level - 1
- The length of an air column trapped in a capillary tube by means of a ...
Text Solution
|
- An ideal gas mixtrue filled inside a balloon expands according to the ...
Text Solution
|
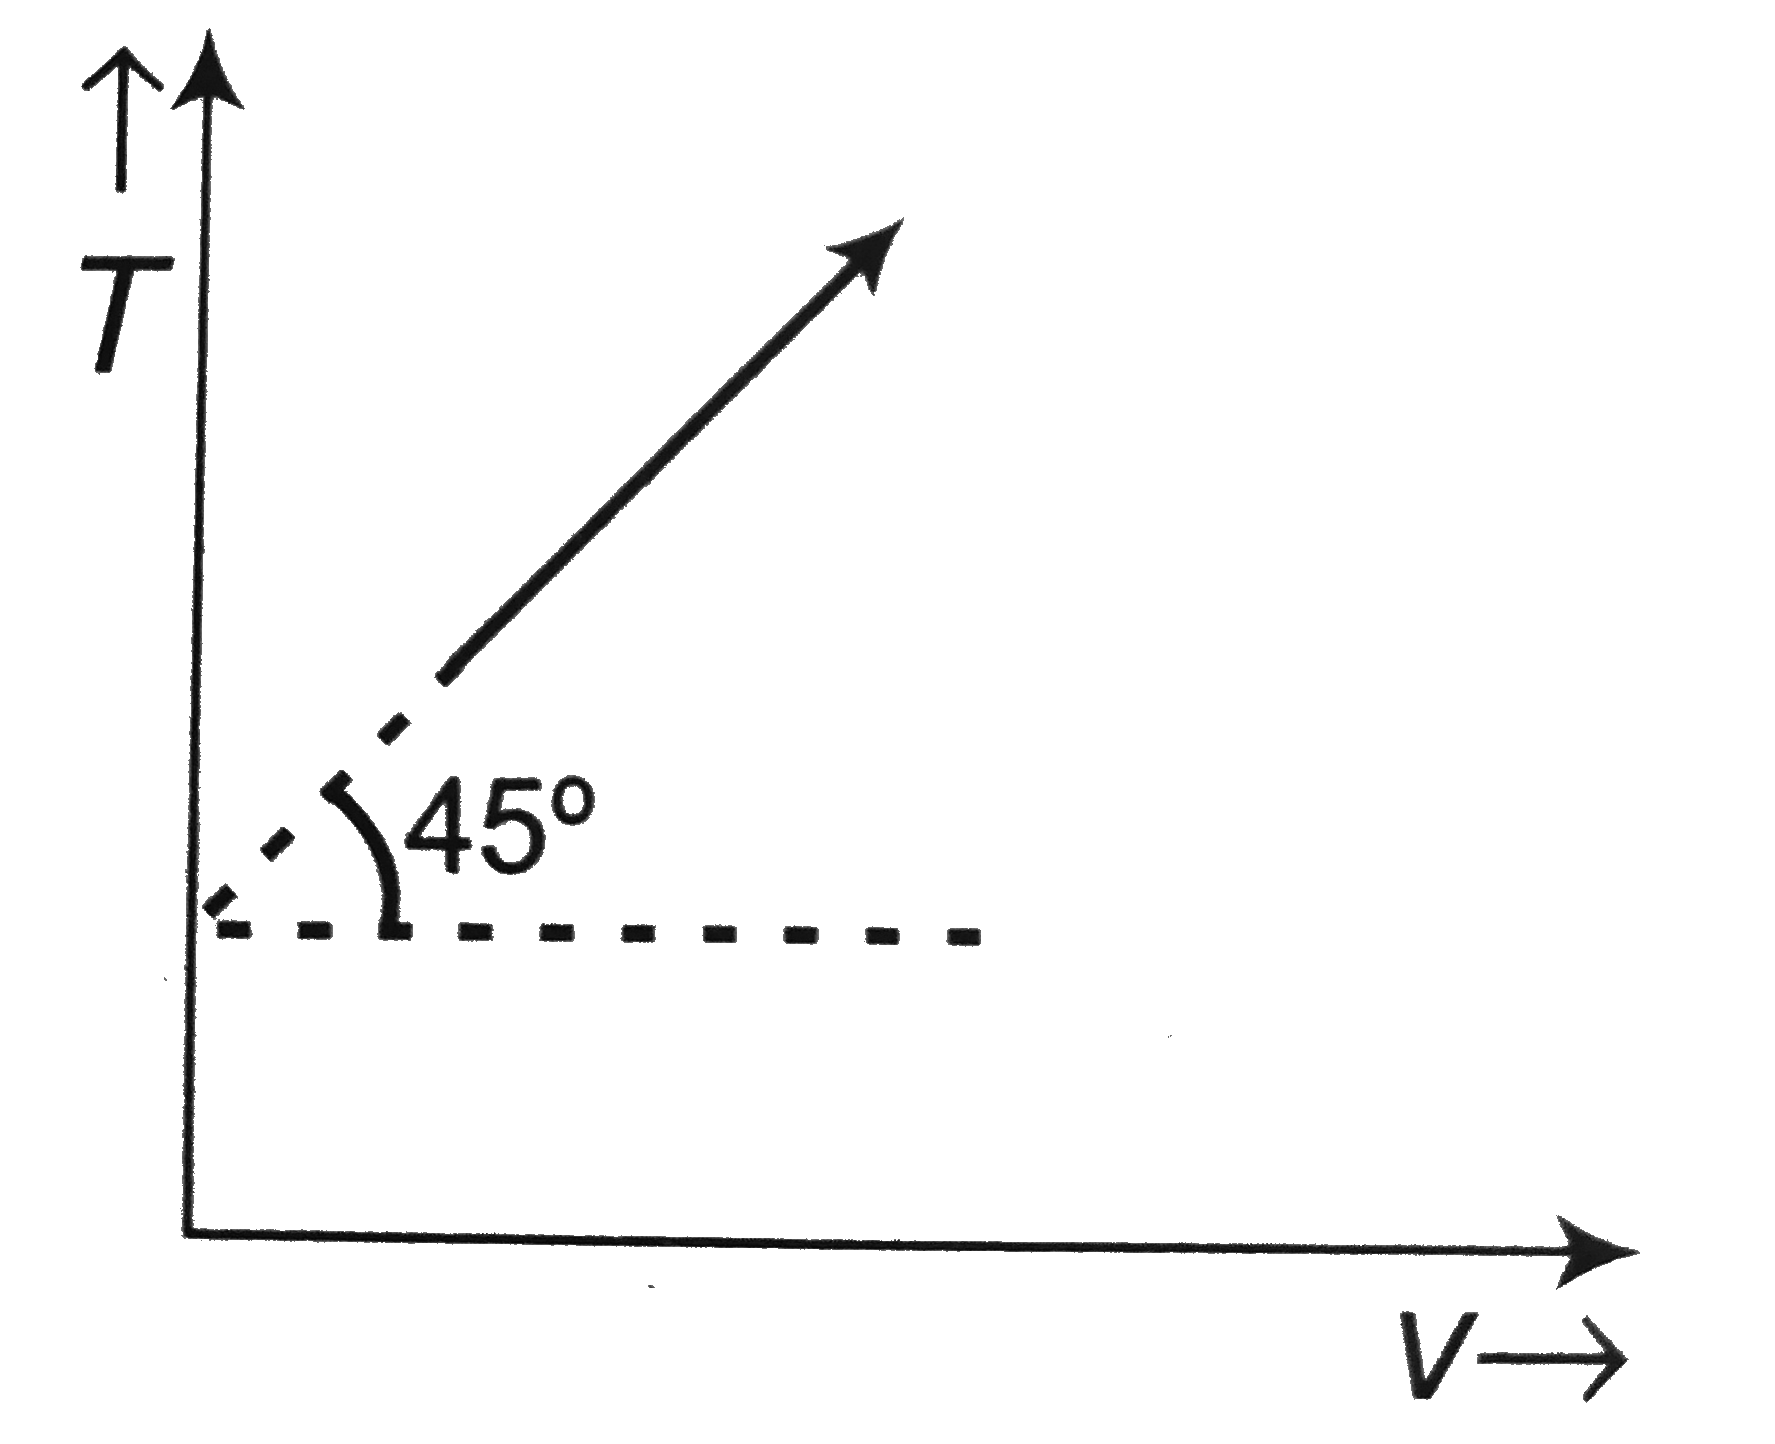
- The given curve represents the variation of temperature as a function ...
Text Solution
|
- At the top of a mountain a thermometer reads 7^(0)C and barometer read...
Text Solution
|
- The figure shows graphs of pressure versus density for an ideal gas at...
Text Solution
|
- When the tmperature of a gas filled in a closed vessel is increased by...
Text Solution
|
- When a large bubble rises from the bottom of a lake to the surface, it...
Text Solution
|
- n1 mole of a monoatomic gas is mixed with n2 mole of a diatomic gas. ...
Text Solution
|
- In a very good vacuum system in the laboratory, the vacuum attained wa...
Text Solution
|
- The given (p - U) graph shows the variation of internal energy of an i...
Text Solution
|
- A vessel of volume 50 litre contains an ideal gas at 0^@ C. A portion ...
Text Solution
|
- A glass container encloses gas at a pressure 4 xx10^5 Pa and 300 K te...
Text Solution
|
- One mole of ideal gas goes through processP = (2V^2)/(1+V^2). Then ch...
Text Solution
|
- The first law of theromodynamics is a statement of
Text Solution
|
- For a p-V plot, the slope of an adiabatic curve = x × slope of isother...
Text Solution
|
- The average degree of freedom per molecule for a gas is 6. The gas per...
Text Solution
|
- 30 litre of a gas at STP is isothermally compressed to 6 litre. Amount...
Text Solution
|
- Four curves A, B, C and D are drawn in Fig. for a given amount of gas....
Text Solution
|
- Two adiabatic expansions of n mole of same gas are shown. If VB/VA = V...
Text Solution
|
- Ideal mono-atomic gas is taken through process such that dQ = 3dU. The...
Text Solution
|