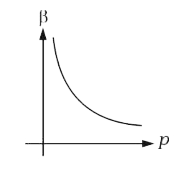
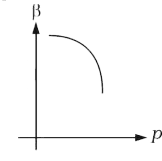
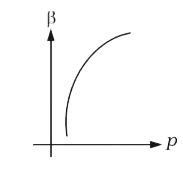
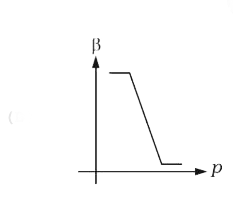
Home
Class 12
PHYSICS
Which of the following graphs correctly ...

Which of the following graphs correctly represents the variation of `beta=-(dV//dP)/V`
with P for an ideal gas at constant temperature?

A

B

C

D

Text Solution

AI Generated Solution

The correct Answer is:
To solve the problem of determining how the parameter \( \beta = -\frac{dV}{dP} \cdot \frac{1}{V} \) varies with pressure \( P \) for an ideal gas at constant temperature, we can follow these steps: ### Step 1: Understand the Ideal Gas Law The ideal gas law is given by the equation: \[ PV = nRT \] where \( P \) is the pressure, \( V \) is the volume, \( n \) is the number of moles, \( R \) is the universal gas constant, and \( T \) is the temperature. ### Step 2: Differentiate the Ideal Gas Law At constant temperature, we can differentiate the ideal gas law with respect to pressure \( P \). The differentiation gives us: \[ P \frac{dV}{dP} + V = 0 \] This is because \( nRT \) is constant when temperature \( T \) is constant. ### Step 3: Solve for \(\frac{dV}{dP}\) Rearranging the equation from Step 2, we can isolate \( \frac{dV}{dP} \): \[ P \frac{dV}{dP} = -V \] \[ \frac{dV}{dP} = -\frac{V}{P} \] ### Step 4: Substitute into the Expression for \(\beta\) Now, we substitute \( \frac{dV}{dP} \) into the definition of \( \beta \): \[ \beta = -\frac{dV}{dP} \cdot \frac{1}{V} \] Substituting \( \frac{dV}{dP} = -\frac{V}{P} \): \[ \beta = -\left(-\frac{V}{P}\right) \cdot \frac{1}{V} \] This simplifies to: \[ \beta = \frac{1}{P} \] ### Step 5: Analyze the Relationship The relationship \( \beta = \frac{1}{P} \) indicates that \( \beta \) is inversely proportional to \( P \). This means as pressure \( P \) increases, \( \beta \) decreases. ### Step 6: Graphical Representation The graph of \( \beta \) versus \( P \) will be a hyperbola, showing that \( \beta \) decreases as \( P \) increases. Specifically, it will approach zero as \( P \) increases indefinitely. ### Conclusion Thus, the correct graph representing the variation of \( \beta \) with \( P \) for an ideal gas at constant temperature is a hyperbolic graph, indicating that \( \beta \) is inversely proportional to \( P \). ---

To solve the problem of determining how the parameter \( \beta = -\frac{dV}{dP} \cdot \frac{1}{V} \) varies with pressure \( P \) for an ideal gas at constant temperature, we can follow these steps: ### Step 1: Understand the Ideal Gas Law The ideal gas law is given by the equation: \[ PV = nRT \] where \( P \) is the pressure, \( V \) is the volume, \( n \) is the number of moles, \( R \) is the universal gas constant, and \( T \) is the temperature. ...
Promotional Banner

Topper's Solved these Questions

  • GASEOUS STATE & THERMODYNAMICS

    VMC MODULES ENGLISH|Exercise JEE MAIN (ARCHIVE )|81 Videos
  • ENERGY & MOMENTUM

    VMC MODULES ENGLISH|Exercise JEE ADVANCE (ARCHIVE) - TRUE/FALSE TYPE|1 Videos
  • GRAVITATION

    VMC MODULES ENGLISH|Exercise JEE Advance (Archive) TRUE/FALSE|1 Videos

Similar Questions

Explore conceptually related problems

Which of the following graphs correctly represents the variation of g on the - Earth?

Which of the following diagram correctly represents the variation of internal energy (U) of gas under expansion at constant temperature.

Which of the following graph is incorrect for an ideal gas?

Which of the following graphs represent the behaviour of an ideal gas ?

The velocity -displacement graph of a particle is as shown in the figure. Which of the following graphs correctly represents the variation of acceleration with displacement?

Which of following graphs correctly represents the variation of particle momentum with de-Broglie wavelength?

Which of the following graph correctly represents the variation of molar conductance (Delta_m) with dilution for a strong electrolyte ?

Within elastic limit, which of the following graphs correctly represents the variation of extension in the length of wire with the external load?

Which of the following shown the correct relationship between the pressure 'P' and density rho of an ideal gas at constant temperature?

Which of the following graph represents the variation of resistivity ( rho ) with temperature (T) for copper?

VMC MODULES ENGLISH-GASEOUS STATE & THERMODYNAMICS-JEE ADVANCED (ARCHIVE )
  1. In a given process on an ideal gas, dW = 0 and dQ lt 0. Then for the g...

    Text Solution

    |

  2. p-V plots for two gases during adiabatic process as shown in figure pl...

    Text Solution

    |

  3. Which of the following graphs correctly represents the variation of be...

    Text Solution

    |

  4. A monoatomic ideal gas, initially at temperature T1, is enclosed in a ...

    Text Solution

    |

  5. An ideal gas is taken through cycle A to B to C-A, as shown in Fig. IF...

    Text Solution

    |

  6. An ideal gas undergoes a cyclic process as shown in the given P-T diag...

    Text Solution

    |

  7. An ideal gas is initially at P1,V1 is expands isothermally to P2,V2 an...

    Text Solution

    |

  8. The presssure of a medium is changed from 1.01xx10^(5) Pa to 1.165xx...

    Text Solution

    |

  9. An ideal gas is expanding such that PT^2= constant. The coefficient of...

    Text Solution

    |

  10. A real gas behaves like an ideal gas if its

    Text Solution

    |

  11. 5.6 litre of helium gas at STP is adiabatically compressed to 0.7 litr...

    Text Solution

    |

  12. A mixture of 2 moles of helium gas ( (atomic mass)=4a.m.u ) and 1 mole...

    Text Solution

    |

  13. Two moles of ideal helium gas are in a rubber balloon at 30^@C. The ba...

    Text Solution

    |

  14. Two non-reactive monoatomic ideal gases have their atomic masses in th...

    Text Solution

    |

  15. A gas is enclosed in a cylinder with a movable frictionless piston. It...

    Text Solution

    |

  16. For an ideal gas

    Text Solution

    |

  17. An ideal gas is taken from the state A (pressure p, volume V) to the s...

    Text Solution

    |

  18. During the melting of a slab of ice at 273 K a atmospheric pressure

    Text Solution

    |

  19. Let barv,v(rms) and vp respectively denote the mean speed. Root mean s...

    Text Solution

    |

  20. Cv and Cp denote the molar specific heat capacities of a gas at consta...

    Text Solution

    |