Home
Class 12
PHYSICS
The volume versus temperature graph for ...

The volume versus temperature graph for a certain amount of a perfect gas at two pressure `P_1` and `P_2` are shown in figure. Which one is greater `–P_1` or `P_2` ?

Text Solution

Verified by Experts

`"pV = nRT"`
`:." "V = ((nR)/(p))T`
Comparing this with `Y = m x, V - T`. Graph is a straight line passing through origin with slope` = (nR)/P`
or slope `prop 1/p("slope")_1 gt ("slope")_2" ":." "P_1 lt P_2`
Promotional Banner

Topper's Solved these Questions

  • GASEOUS STATE & THERMODYNAMICS

    VMC MODULES ENGLISH|Exercise JEE MAIN (ARCHIVE )|81 Videos
  • ENERGY & MOMENTUM

    VMC MODULES ENGLISH|Exercise JEE ADVANCE (ARCHIVE) - TRUE/FALSE TYPE|1 Videos
  • GRAVITATION

    VMC MODULES ENGLISH|Exercise JEE Advance (Archive) TRUE/FALSE|1 Videos

Similar Questions

Explore conceptually related problems

The volume V versus temperature T graphs for a certain amount of a perfect gas at two pressure p_1 and p_2 are as shown in Fig. Show that p_1 is less than p_2.

The volume V versus temperature T graphs for a certain amount of a perfect gas at two pressure p_1 and p_2 are as shown in Fig. It follows from the graphs that p_1 is greater than p_2.

Figure shows volume - temperature (V-T) graph for same mass of an ideal gas at two different pressures P_1 and P_2 . Hence

For V versus T curves at constant pressure P_1 and P_2 for and ideal gas shown in figure-

For an ideal gas V - T curves at constant pressure P_(1) & P_(2) are shown in figure, from the figure

V vs T curves at constant pressure P_1 and P_2 for an ideal gas are shown in the figure. Which of the following is correct?

V vs T curves at constant pressure P_(1) and P_(2) for an ideal gas are shown below Which is correct ?

For V versus T curves at constant pressure P_(1) and P_(2) for an ideal gas are shown in the figure given below

Volume versus temperature graph of two moles of helium gas is as shown in figure. The ratio of heat absorbed and the work done by the gas in process 1-2 is

Volume versus temperature graph of two moles of helium gas is as shown in figure. The ratio of heat absorbed and the work done by the gas in process 1-2 is

VMC MODULES ENGLISH-GASEOUS STATE & THERMODYNAMICS-JEE ADVANCED (ARCHIVE )
  1. A thermodynamic system is taken from an initial state I with internal ...

    Text Solution

    |

  2. One mole of a monatomic ideal gas undergoes an adiabatic expansion in ...

    Text Solution

    |

  3. "A solid sphere of copper of radius R and a hollow sphere of the same ...

    Text Solution

    |

  4. One mole of a monatomic ideal gas is mixed with one mole of a diatomic...

    Text Solution

    |

  5. During an experiment, an ideal gas is found to obey an additional law ...

    Text Solution

    |

  6. An ideal gas has a molar heat capacity at constant pressure of Cp = 2....

    Text Solution

    |

  7. A container of volume 1m^3 is divided into two equal parts by a partit...

    Text Solution

    |

  8. An ideal gas with pressure P, volume V and temperature T is expanded i...

    Text Solution

    |

  9. A closed container of volume 0.02m^3contains a mixture of neon and arg...

    Text Solution

    |

  10. A gas thermometer is used as a standard thermometer for measurement of...

    Text Solution

    |

  11. One mole of an ideal mono-atomic gas is taken round cyclic process ABC...

    Text Solution

    |

  12. One mole of ideal monoatomic gas is taken round the cyclic process a...

    Text Solution

    |

  13. One mole of an ideal mono-atomic gas is taken round cyclic process ABC...

    Text Solution

    |

  14. One mole of an ideal mono-atomic gas is taken round cyclic process ABC...

    Text Solution

    |

  15. An insulated box containing a monoatomic gas of molar mass (M) moving ...

    Text Solution

    |

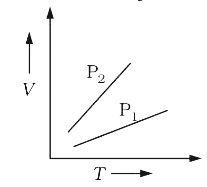
  16. The volume versus temperature graph for a certain amount of a perfect ...

    Text Solution

    |

  17. Two different gases at the same temperature have equal root mean squar...

    Text Solution

    |

  18. The curves A and B in the figure shown P-V graphs for an isothermal an...

    Text Solution

    |

  19. The root-mean-square (rms) speed of oxygen molecules (O(2)) at a certa...

    Text Solution

    |

  20. At a given temperature, the specific heat of a gas at constant pressur...

    Text Solution

    |