A
B
C
D
Text Solution
Verified by Experts
The correct Answer is:


Topper's Solved these Questions
PROPERTIES OF MATTER
VMC MODULES ENGLISH|Exercise JEE Main (Archive) Level - 1|48 VideosPROPERTIES OF MATTER
VMC MODULES ENGLISH|Exercise JEE Advanced(Archive) Level - 2|1 VideosPROPERTIES OF MATTER
VMC MODULES ENGLISH|Exercise Level -1|90 VideosMOVING CHARGES & MAGNETISM
VMC MODULES ENGLISH|Exercise IN-CHAPTER EXERCISE-K|10 VideosQUIZ
VMC MODULES ENGLISH|Exercise PHYSICS|30 Videos
Similar Questions
Explore conceptually related problems
VMC MODULES ENGLISH-PROPERTIES OF MATTER-Level -2
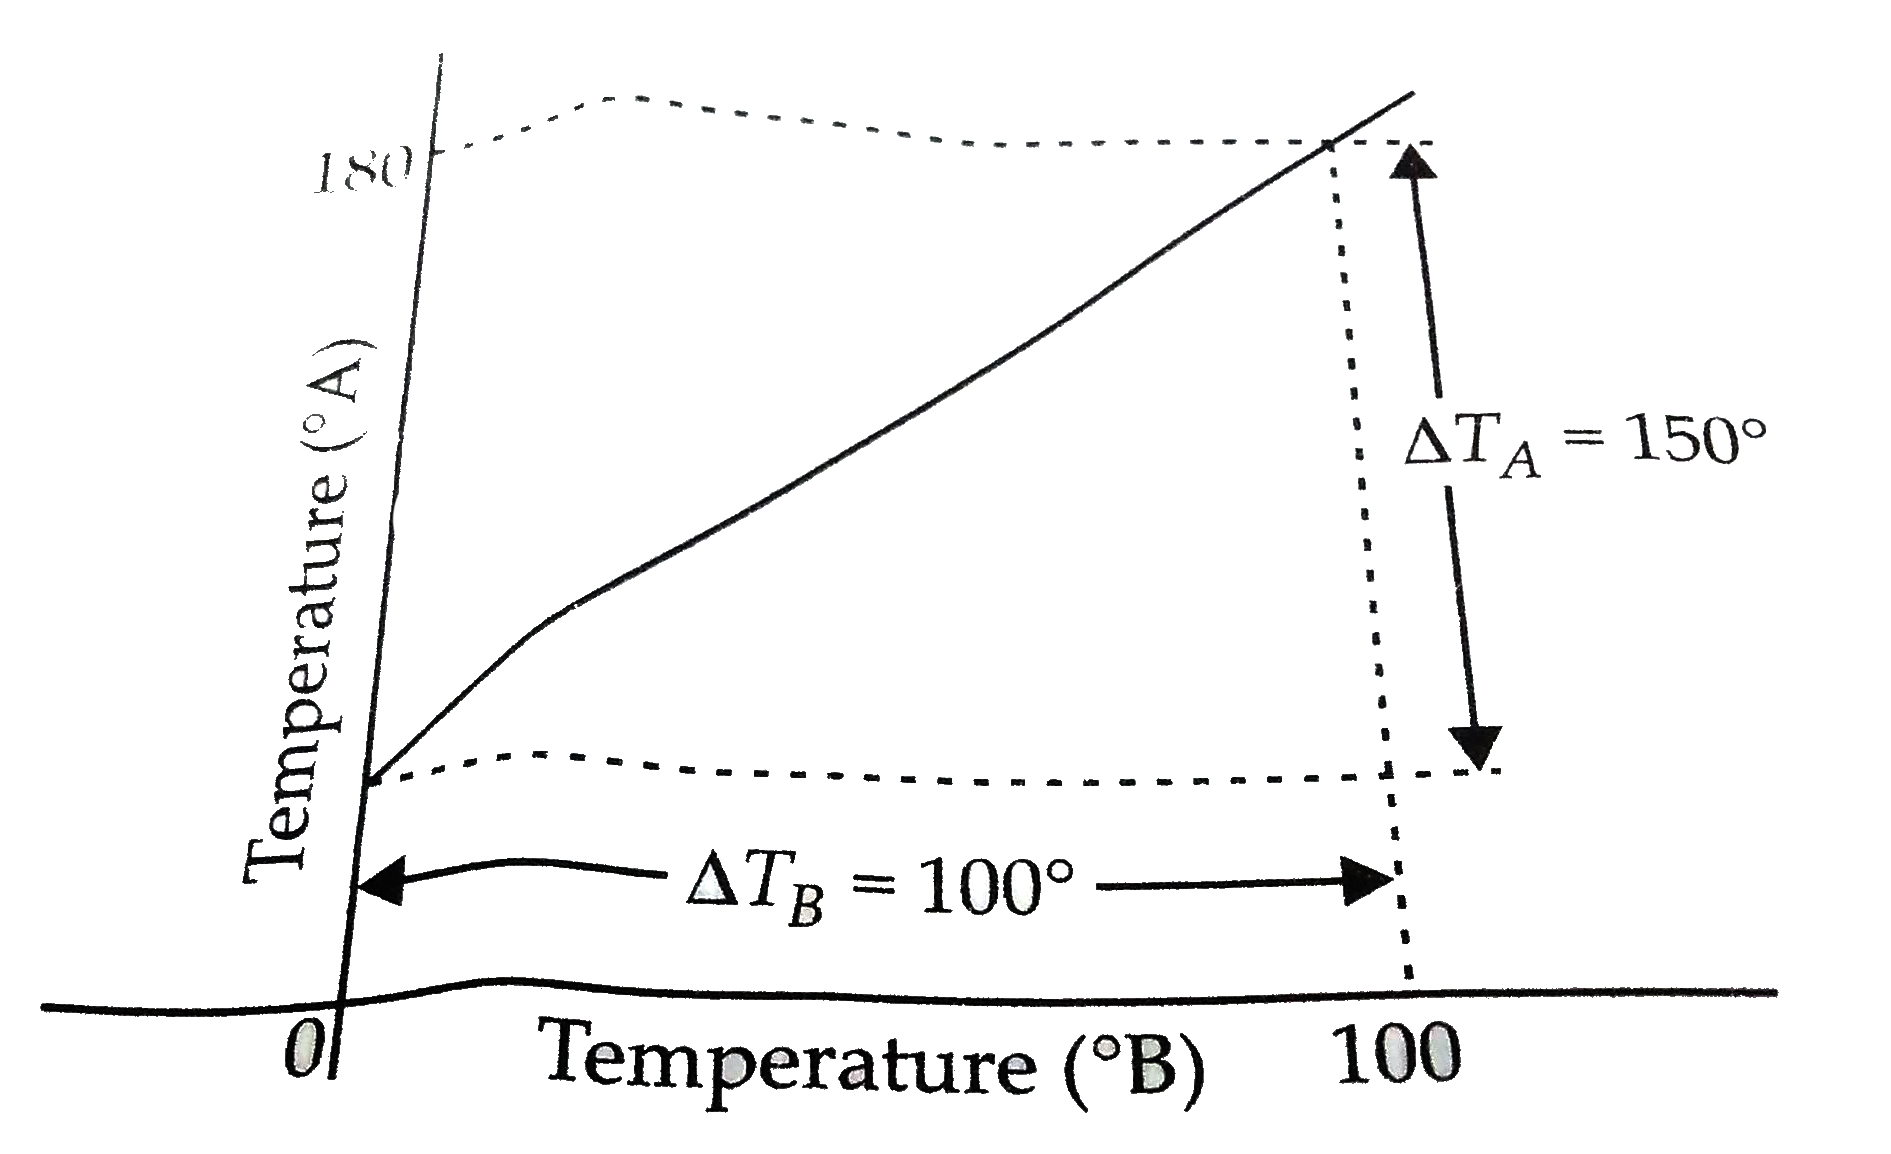
- The graph between two temperature scales A and B is shown in figure....
Text Solution
|
- An iron rocket fragment initially at -100^@C enters the earth's atmosp...
Text Solution
|
- Four spheres A, B, C and D have their radii in arithmetic progression ...
Text Solution
|
- A beaker contains 200 g of water. The heat capacity of the beaker is e...
Text Solution
|
- A liquid of density 0.85 g//cm^(3) flows through a calorimeter at the ...
Text Solution
|
- A 0.60 kg sample of water and a sample of ice are placed in two compar...
Text Solution
|
- A 0.60 kg sample of water and a sample of ice are placed in two compar...
Text Solution
|
- A 0.60 kg sample of water and a sample of ice are placed in two compar...
Text Solution
|
- In a container of negligible mass, ‘m’ grams of steam at 100°C is adde...
Text Solution
|
- In two experiments with a countinous flow calorimeter to determine the...
Text Solution
|
- A meter scale calibarated for temperature T is used to measure the len...
Text Solution
|
- The design of a physical instrument requires that there be a constant ...
Text Solution
|
- Two rods each of length L(2) and coefficient of linear expansion alpha...
Text Solution
|
- A thread of liquid is in a uniform capillary tube of length L. As meas...
Text Solution
|
- The coefficient of linear expansion of an in homogeneous rod change li...
Text Solution
|
- The loss of weight of a solid when immersed in a liquid at 0^(@)C is W...
Text Solution
|
- When the temperature of a copper coin is raised by 80^@C, its diameter...
Text Solution
|
- A vessel is partly filled with liquid. When the vessel is cooled to a ...
Text Solution
|
- If linear charge density of a wire as shown in the figure is lambda
Text Solution
|
- Two vessels connected at the bottom by a thin pipe with a sliding plug...
Text Solution
|