Home
Class 12
PHYSICS
Figure shows the stress-strain graphs fo...

Figure shows the stress-strain graphs for materials .`A` and `B`. From the graph it follows that

A

material A has a higher Young’s modulus

B

material B is more ductile

C

material A can withstand greater stress

D

material B can withstand greater stress

Text Solution

Verified by Experts

The correct Answer is:
AC

The slope of the linear portion of the curve gives the Young’s modulus of the material. The slope of the linear portion OP for material A is greater than that of the linear portion OR for material B. Hence, statement (A) is correct. The plastic region for material A (from P to Q) is greater than that (from R to S) for material B, which indicates that material A is more ductile. Hence, statement (B) is in correct. The breaking stress for material B in (i.e., stress corresponding to point S) is less than that for material A (i.e., stress corresponding to point Q), hence material A is stronger than material B.
Promotional Banner

Topper's Solved these Questions

  • PROPERTIES OF MATTER

    VMC MODULES ENGLISH|Exercise JEE Main (Archive) Level - 1|48 Videos
  • PROPERTIES OF MATTER

    VMC MODULES ENGLISH|Exercise JEE Advanced(Archive) Level - 2|1 Videos
  • PROPERTIES OF MATTER

    VMC MODULES ENGLISH|Exercise Level -1|90 Videos
  • MOVING CHARGES & MAGNETISM

    VMC MODULES ENGLISH|Exercise IN-CHAPTER EXERCISE-K|10 Videos
  • QUIZ

    VMC MODULES ENGLISH|Exercise PHYSICS|30 Videos

Similar Questions

Explore conceptually related problems

Figure shows the stress-strain curve of two metals P and Q . From the graph, it can be concluded that

The stress- strain graphs for materials A and B are as shown. Choose the correct alternative

The stress versus strain graph for two materials A and B are shown in fig. the graph are on the same scale. ltbr. (a) Which material has greater Young's modulus? (b) which of the two is stronger material?

The stress-strain graphs for two materials A and are shown in figure. The graphs are drawn to the same scale. Select the correct statement

The stress and strain graphs for two materials, A and B are shown here. Answer the following :give reasons

Figure shows the displacement-time graphs of two simple harmonic motions I and II. From the graph it follows that

Materials get deformed when force is applied. Some of them regain their status when the applied force is removed. They are termed as elastic. Those of which not regaining are called plastic. There may be delay in the regaining in some materials. They are said to have got elastic aftereffect, since they have gone beyond the elastic limit. Repeated application and removal of force leads to fatigueness in the material. Fatigued materials may break at any point time and so are avoided. The stress strain graph for two materials A and B is shown in the following figure: The time in which the two materials regain their original status is t_(A) and t_(B) related as t_(B)=2t_(B) . Then the material under elastic aftereffect (relatively) is

Materials get deformed when force is applied. Some of them regain their status when the applied force is removed. They are termed as elastic. Those of which not regaining are called plastic. There may be delay in the regaining in some materials. They are said to have got elastic aftereffect, since they have gone beyond the elastic limit. Repeated application and removal of force leads to fatigueness in the material. Fatigued materials may break at any point time and so are avoided. The stress strain graph for two materials A and B is shown in the following figure: The strength of the material A and B is S_(A) and S_(B) , respectively, while the longevity of plastic behaviour is L_(A) and L_(B) . Then

Materials get deformed when force is applied. Some of them regain their status when the applied force is removed. They are termed as elastic. Those of which not regaining are called plastic. There may be delay in the regaining in some materials. They are said to have got elastic aftereffect, since they have gone beyond the elastic limit. Repeated application and removal of force leads to fatigueness in the material. Fatigued materials may break at any point time and so are avoided. The stress strain graph for two materials A and B is shown in the following figure: If the intensity of A and B is E_(A) and E_(B) , respectively

The stress versus strain graphs for two materials A and B are shown in Figure. ( The graphs are drawn to the same scale) (a) Which material has greater Young's modulus ? (b) Which material is more ductile ? ( c) Which is more brittle ? ( d) Which of the two is the strong material?

VMC MODULES ENGLISH-PROPERTIES OF MATTER-Level -2
  1. A long solid cylinder is radiating power. It is remolded into a number...

    Text Solution

    |

  2. Energy of radiation emitted by a black body at temperature 3000 K is u...

    Text Solution

    |

  3. A sphere and a cube of same material and same total surface area are p...

    Text Solution

    |

  4. Gibbs-Helmoholtz equation relates the free energy change to the enthal...

    Text Solution

    |

  5. A body with an initial temperature theta(1) is allowed to cool in a su...

    Text Solution

    |

  6. Solar constant is 1370 W//m^(2) . 70% of the light incident on the e...

    Text Solution

    |

  7. A thin copper rod of uniform cross section A square metres and of leng...

    Text Solution

    |

  8. The thermal conductivity of a rod depends on :

    Text Solution

    |

  9. Two identical objects A and B are at temperatures TA and TB. Respectiv...

    Text Solution

    |

  10. A heated body emits radiation which has maximum intensity at frequency...

    Text Solution

    |

  11. Two rods are joined between fixed supports as shown in the figure. Con...

    Text Solution

    |

  12. A flask of mercury is sealed off at 20^@C and is completely filled wit...

    Text Solution

    |

  13. A wire of length l, area of cross section A and Young’s modulus of ela...

    Text Solution

    |

  14. A uniform plank is resting over a smooth horizontal floor and is pulle...

    Text Solution

    |

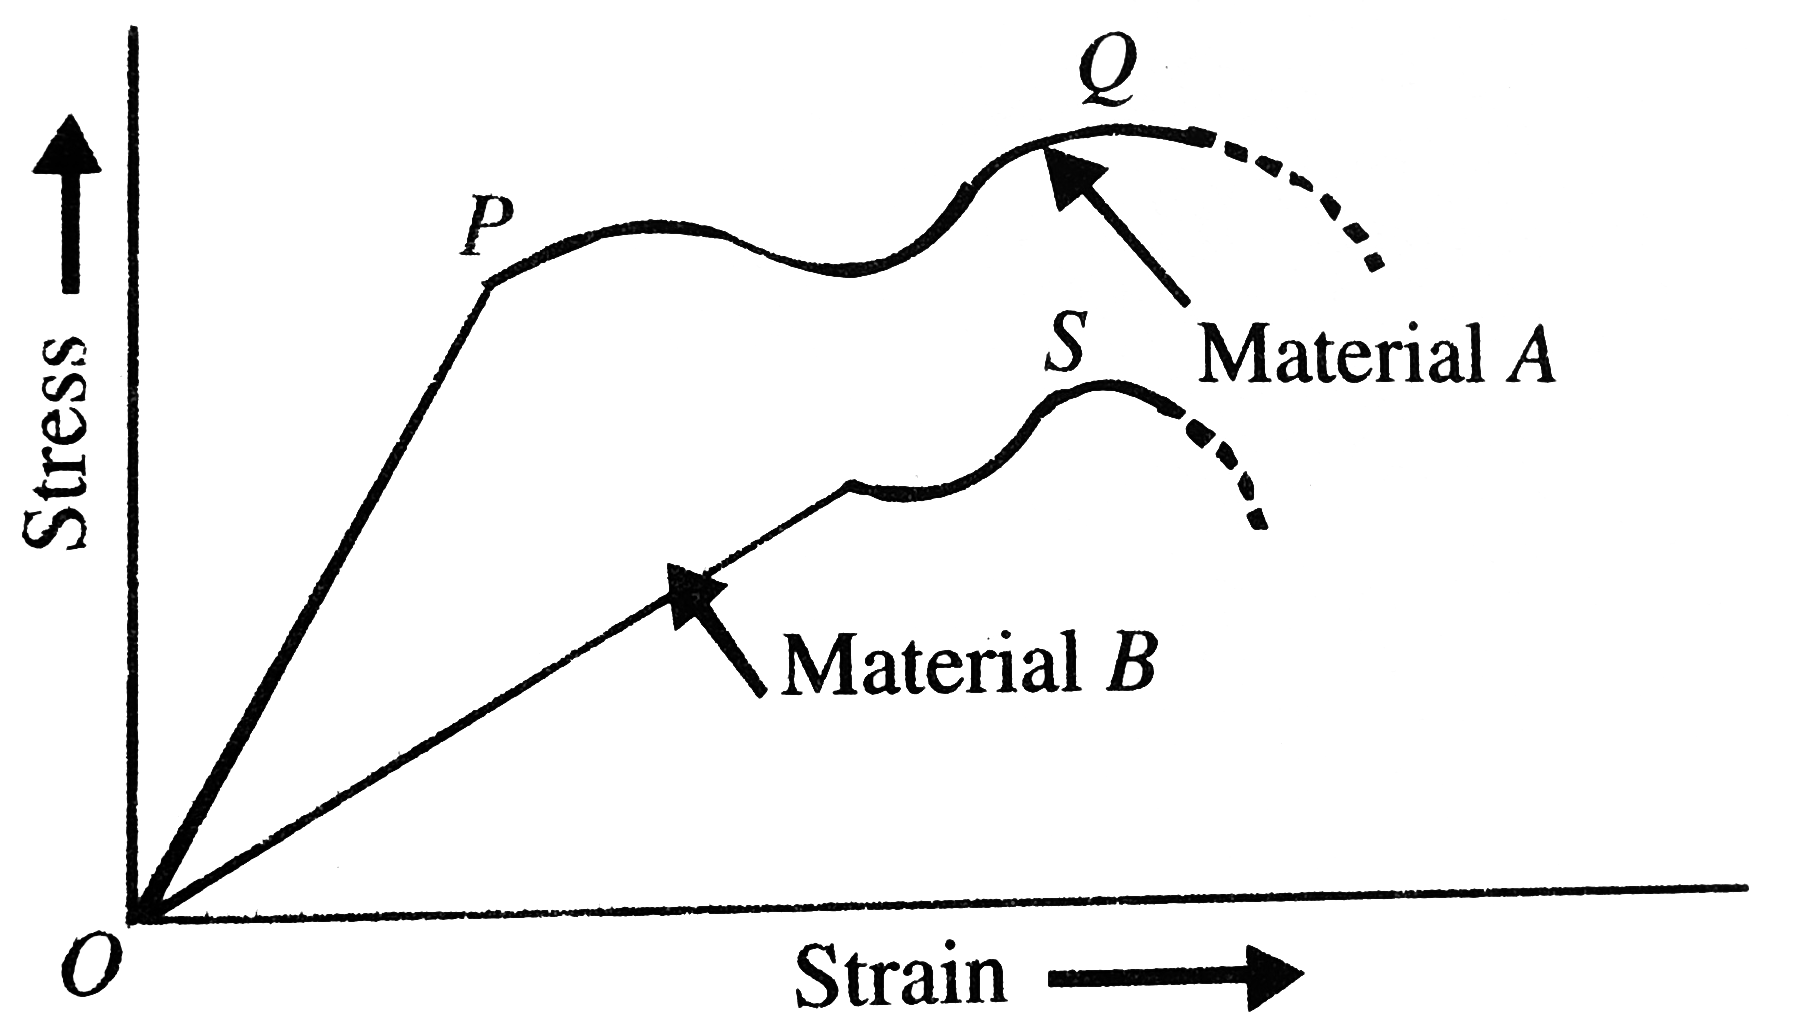
  15. Figure shows the stress-strain graphs for materials .A and B. From the...

    Text Solution

    |

  16. In the figure shown, A and B are two short steel rods each of cross-se...

    Text Solution

    |

  17. In the figure shown, A and B are two short steel rods each of cross-se...

    Text Solution

    |

  18. In the figure shown, A and B are two short steel rods each of cross-se...

    Text Solution

    |

  19. A thin ring of radius R is made of a material of density rho and Youn...

    Text Solution

    |

  20. A wire having a length L and cross- sectional area A is suspended at o...

    Text Solution

    |