
Text Solution
Verified by Experts


Topper's Solved these Questions
STATES OF MATTER
VMC MODULES ENGLISH|Exercise Level-1|75 VideosSTATES OF MATTER
VMC MODULES ENGLISH|Exercise Level-2|50 VideosSTATES OF MATTER
VMC MODULES ENGLISH|Exercise LEVEL -0 ( Short Answer Type)|8 VideosSTATES OF MATTER
VMC MODULES ENGLISH|Exercise IMPECCABLE|50 VideosSTOICHIOMETRY - I
VMC MODULES ENGLISH|Exercise JEE Advanced (Archive)|31 Videos
Similar Questions
Explore conceptually related problems
VMC MODULES ENGLISH-STATES OF MATTER-LEVEL -0 (Short Answer Type-II)
- For real gases the relation between p, V and T is given by c=van der W...
Text Solution
|
- The relation between pressure exerted by an ideal gas (p("ideal")) and...
Text Solution
|
- The relation between pressure exerted by an ideal gas (p("ideal")) and...
Text Solution
|
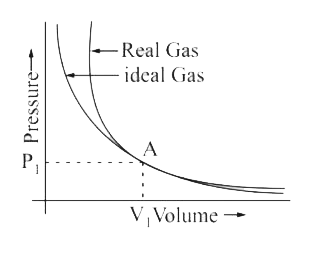
- Pressure versus volume graph for real gas and are shown in figure. Ans...
Text Solution
|
- Pressure versus volume graph for real gas and are shown in figure. Ans...
Text Solution
|
- Pressure versus volume graph for real gas and are shown in figure. Ans...
Text Solution
|
- Isotherms of carbon dioxide at various temperatures are represented in...
Text Solution
|
- Isotherms of carbon dioxide at various temperatures are represented in...
Text Solution
|
- Isotherms of carbon dioxide at various temperatures are represented in...
Text Solution
|
- Isotherms of carbon dioxide at various temperatures are represented in...
Text Solution
|
- Isotherms of carbon dioxide at various temperatures are represented in...
Text Solution
|
- The variation of vapour pressure of different liquids with temperature...
Text Solution
|
- The variation of vapour pressure of different liquids with temperature...
Text Solution
|
- The variation of vapour pressure of different liquids with temperature...
Text Solution
|
- The variation of vapour pressure of different liquids with temperature...
Text Solution
|
- Two containers A and B have the same volume. Container A contains 5 mo...
Text Solution
|
- A balloon of diameter 21 meter weight 100 kg. Calculate its pay-load, ...
Text Solution
|
- An open vessel at 27^@C is heated until three fifth of the air in it h...
Text Solution
|
- An open vessel at 27^(@)C is heated until 3//5^(th) of the air in it h...
Text Solution
|
- An open vessel at 27^(@)C is heated until 3//5^(th) of the air in it h...
Text Solution
|