Home
Class 12
CHEMISTRY
Following represents the Maxwell distrib...

Following represents the Maxwell distribution curve for an ideal gas at two temperature `T_(1)` and `T_(2)` . Which of the following option(s) is/are true?

A

Total area under the two curves is independent of moles of gas

B

`u_(m p)` decreases as temperature decreases

C

`T_(1) gt T_(2)` and hence higher the temperature, sharper the curve

D

The fraction of molecules having speed `u_(m p)` decreases as temperature increases

Text Solution

Verified by Experts

The correct Answer is:
A, B, D

(A) area under the curve gives fraction of molecules and total area is constant
(B) `u_(m p)` decreases with decrease in temperature
(C) `T_(2)` is higher temperature
(D) As seen from graph, `:.` A, B, D
Promotional Banner

Topper's Solved these Questions

  • STATES OF MATTER

    VMC MODULES ENGLISH|Exercise Level-2 (NUMBERICAL VALUE TYPE FOR JEE MAIN|15 Videos
  • STATES OF MATTER

    VMC MODULES ENGLISH|Exercise JEE-Main ( ARCHIVE )|17 Videos
  • STATES OF MATTER

    VMC MODULES ENGLISH|Exercise Level-1|75 Videos
  • STATES OF MATTER

    VMC MODULES ENGLISH|Exercise IMPECCABLE|50 Videos
  • STOICHIOMETRY - I

    VMC MODULES ENGLISH|Exercise JEE Advanced (Archive)|31 Videos

Similar Questions

Explore conceptually related problems

Figure shows graphs of pressure vs density for an ideal gas at two temperature T_(1) and T_(2) . Which of the following is correct?

Figure shows graphs of pressure versus density for an ideal gas at two temperatures T_(1) and T_(2) Which is correct ? .

The adjoining fgure shows graph of pressure and volume of a gas at two temperatures T_(1) and T_(2) Which one the following is correct

The specific heat of an ideal gas varies with temperature T as

Shown below are the black body radiation curves at temperature T_(1) and T_(2) (T_(2) gt T_(1)) . Which of the following plots is correct?

Which of the following expressions is true for an ideal gas ?

Following graph represents a pressure (P) volume (V) relationship at a fixed temperature (T) for n moles of a real gas. The graph has two regions marked (I) and (II) . Which of the following options is true.

Following graph represents a pressure (P) volume (V) relationship at a fixed temperature (T) for n moles of a real gas. The graph has two regions marked (I) and (II) . Which of the following options is true.

Figure shows the isotherms of a fixed mass of an ideal gas at three temperatures T_(A) , T_(B) and T_(C) , then

Which of the Maxwell distribution curves (obtained at different temperatures) shown in the following figure corresponds to the highest temperature of the gas ?

VMC MODULES ENGLISH-STATES OF MATTER-Level-2
  1. A real gas obeying van der Waals equation will resemble ideal gas , if...

    Text Solution

    |

  2. If temperature and volume are same, the pressure of a gas obeying van ...

    Text Solution

    |

  3. The critical pressure P(C) and critical temperature T(C) for a gas obe...

    Text Solution

    |

  4. For non-zero value of force of attraction between gas molecular at lar...

    Text Solution

    |

  5. At Boyle's temperature the value of compressibility factro Z = (PV(m(/...

    Text Solution

    |

  6. The critical density of the gas CO(2) is 0.44 g cm^(-3) at a certain t...

    Text Solution

    |

  7. Which of the following is correct for critical temperature ?

    Text Solution

    |

  8. The vander waal gas constant 'a' is given by

    Text Solution

    |

  9. Which of the following is/are correct?

    Text Solution

    |

  10. Which of the following statements are incorrect?

    Text Solution

    |

  11. Infinite number of flask are connected to one another as shown above. ...

    Text Solution

    |

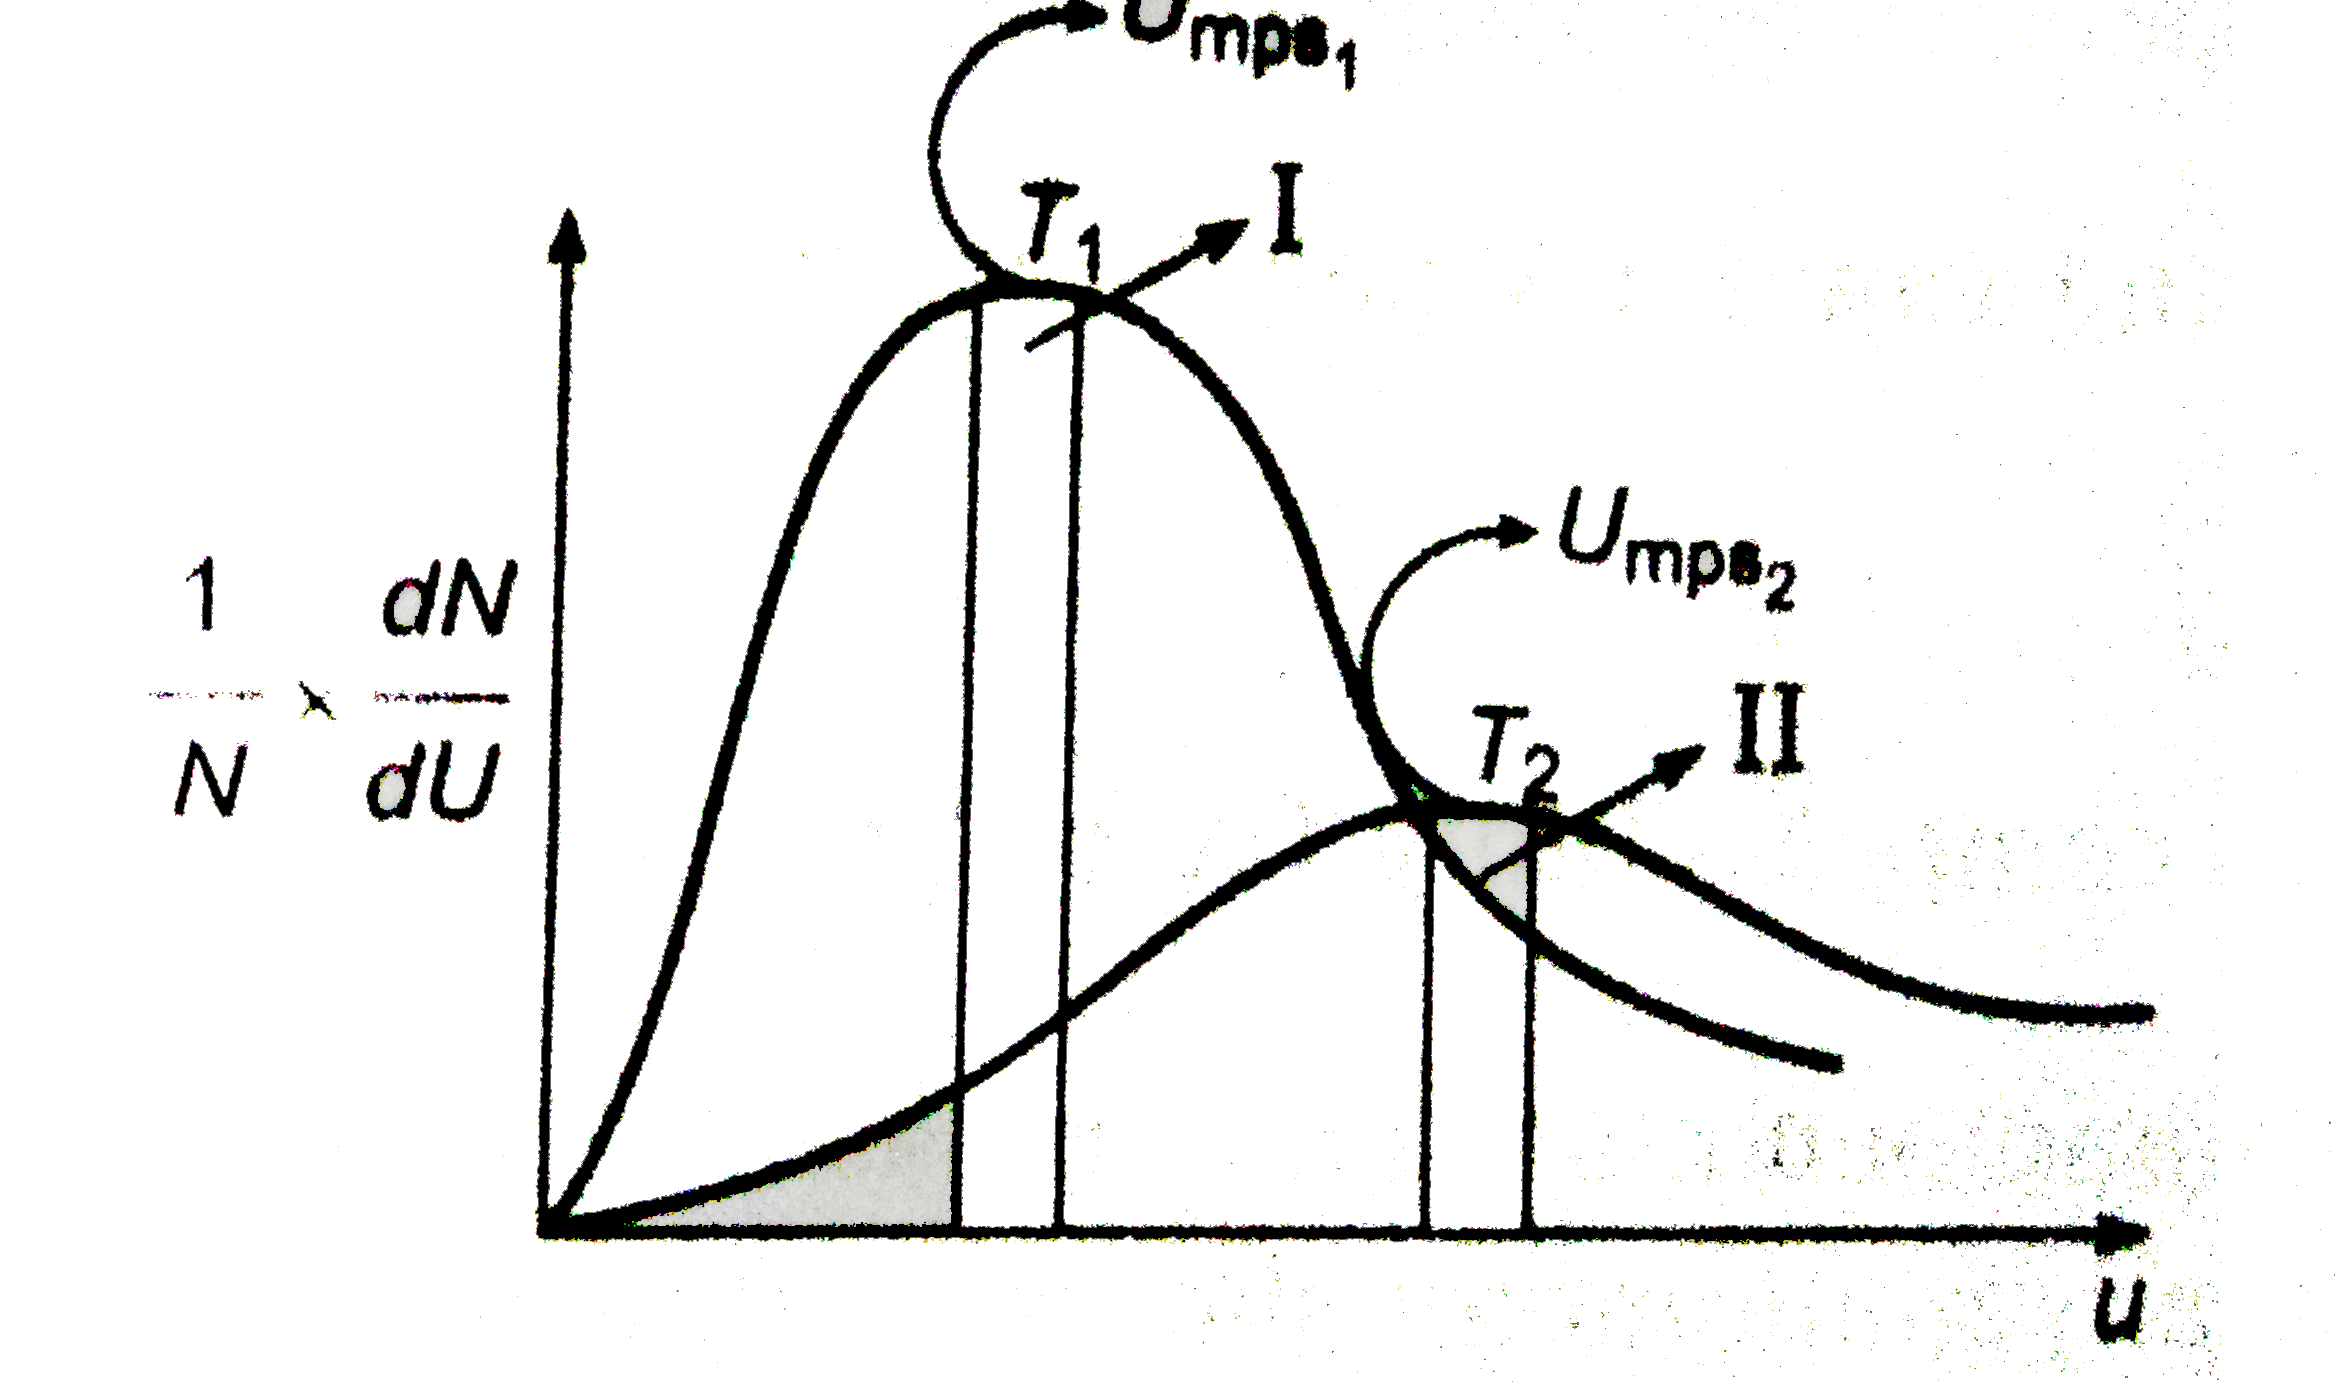
  12. Following represents the Maxwell distribution curve for an ideal gas a...

    Text Solution

    |

  13. At low pressure the van der Waals' equation is reduced to [P +(a)/(V^(...

    Text Solution

    |

  14. Following graph represents a pressure (P) volume (V) relationship at a...

    Text Solution

    |

  15. Density of dry air ( only N(2) and O(2)) is 1.24g litre^(-1) at 760 m ...

    Text Solution

    |

  16. The root mean square speed of hydrogen is sqrt(5) times than that of n...

    Text Solution

    |

  17. A gaseous mixture containing He, CH(4) and SO(2) in 1:2:3 mole ratio, ...

    Text Solution

    |

  18. 6 xx 10^(22) gas molecules each of mass 10^(-24) kg are taken in a ve...

    Text Solution

    |

  19. Two flask A and B of equal volumes maintained at temperature 300 K and...

    Text Solution

    |

  20. The density of gas A is twice that to B at the same temperature. The m...

    Text Solution

    |