A
B
C
D
Text Solution
Verified by Experts


Topper's Solved these Questions
DC CIRCUIT
VMC MODULES ENGLISH|Exercise JEE ADVANCED ARCHIVE|68 VideosDC CIRCUIT
VMC MODULES ENGLISH|Exercise LEVEL-2 DAILY TUTORIAL SHEET-5|10 VideosCURRENT ELECTRICITY
VMC MODULES ENGLISH|Exercise IN-CHAPTER EXERCISE-F|10 VideosDYNAMICS OF A PARTICLE
VMC MODULES ENGLISH|Exercise JEE Advance (Archive) Level - II (SINGLE OPTION CORRECT TYPE )|31 Videos
Similar Questions
Explore conceptually related problems
VMC MODULES ENGLISH-DC CIRCUIT-LEVEL-1 JEE MAIN ARCHIVE
- Two electric bulbs , rated at (25W,220V) and (100W,220V), are conne...
Text Solution
|
- A 200Omega resistor has a certain color code. If one replaces the red ...
Text Solution
|
- A cell of internal resistance r drivers current through an external r...
Text Solution
|
- In the circuit shown, a four-wire potentiometer is made of a 400 cm lo...
Text Solution
|
- In the figure shown, what is the current (in Ampere) drawn from the ba...
Text Solution
|
- A moving coil galvanometer has resistance 50 Omega and it indicates fu...
Text Solution
|
- A write of resistance R is bent to form a square ABCD as shown in the ...
Text Solution
|
- If in a conductor number density of electrons is 8.5xx10^(28) average ...
Text Solution
|
- A uniform wire of resistance =3Omega and length l is stretched to doub...
Text Solution
|
- The resistance of a galvanometer is 50 ohm and the maximum current whi...
Text Solution
|
- Space between tow concentric spheres of radii r(1) and r(2) such that ...
Text Solution
|
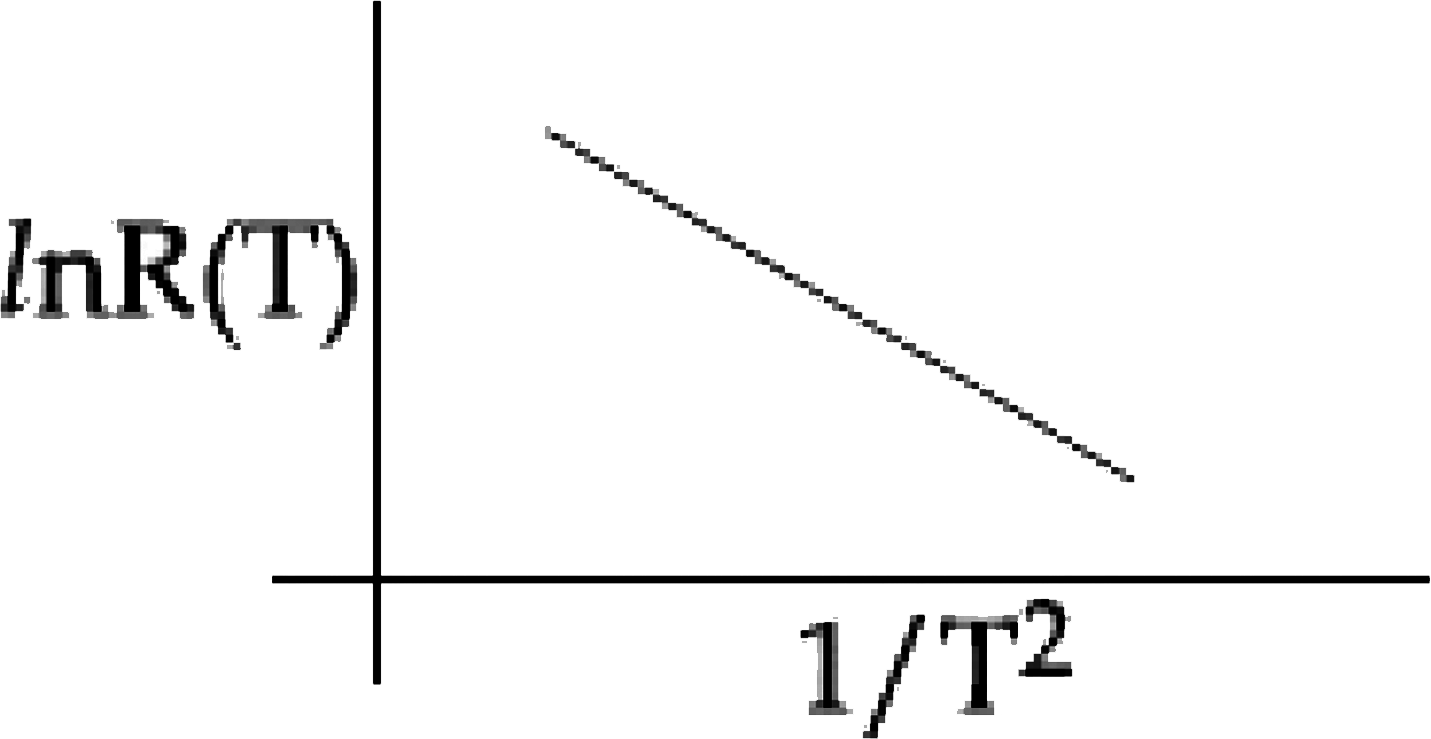
- In an experiment, the resistance of a material is plotted as a functio...
Text Solution
|
- A current of 5 A of passes through a copper conductor (resistivity =1....
Text Solution
|
- A moving coil galvanometer allows a full scale current of 10^(-4) A. A...
Text Solution
|
- In the given circuit, an ideal voltmeter connected across the 10 Omega...
Text Solution
|
- In a meter bridge experiment, the circuit diagram and the correspondin...
Text Solution
|
- A moving coil galvanometer, having a resistance G, produces full scale...
Text Solution
|
- A galvanometer of resistance 100Omega has 50 divisions on its scale a...
Text Solution
|
- To verify Ohm's law, a student connects the voltmeter across the batte...
Text Solution
|
- The resistive network shown below is connected to a D.C. source of 16V...
Text Solution
|