A
B
C
D
Text Solution
Verified by Experts
The correct Answer is:


Similar Questions
Explore conceptually related problems
Recommended Questions
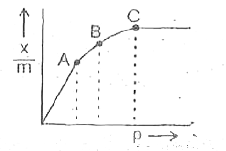
- The graph plotted against adsorption versus pressure P at constant tem...
Text Solution
|
- Assertion: The plot of volume (V) versus pressure (P) at constant temp...
Text Solution
|
- If x gram of gas is adsobed by m gram of adsorbent at pressure P the p...
Text Solution
|
- The plot of volume versus pressure at constant temperature is a…………………...
Text Solution
|
- The linear plot for Freundich adsorption isotherm is
Text Solution
|
- What from Freundich adsorption isotherm equation will take at high pre...
Text Solution
|
- The plot of pressure (P) versus temperature (T) for an ideal gas will ...
Text Solution
|
- A graph is plotted between extent of adsorption vs pressure (P) at con...
Text Solution
|
- The graph plotted against adsorption versus pressure P at constant tem...
Text Solution
|