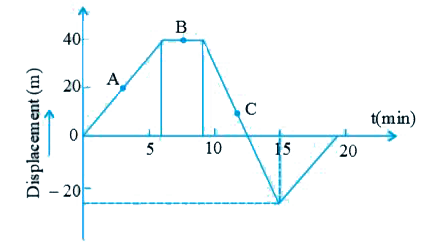
A
B
C
D
Text Solution
Verified by Experts
The correct Answer is:


Topper's Solved these Questions
Motion in Straight Line
VMC MODULES ENGLISH|Exercise IN-CHAPTER EXERCISE-F|10 VideosMotion in Straight Line
VMC MODULES ENGLISH|Exercise IN-CHAPTER EXERCISE-G|10 VideosMotion in Straight Line
VMC MODULES ENGLISH|Exercise IN-CHAPTER EXERCISE-D|10 VideosMOTION IN A STRAIGHT LINE & PLANE
VMC MODULES ENGLISH|Exercise IMPECCABLE|52 VideosMotion in Two Dimensions
VMC MODULES ENGLISH|Exercise MCQ|2 Videos
Similar Questions
Explore conceptually related problems
VMC MODULES ENGLISH-Motion in Straight Line -IN-CHAPTER EXERCISE-E
- A graph between the square of the velocity of a particle and the dista...
Text Solution
|
- The fig. shows the displacement time graph of a particle moving on a s...
Text Solution
|
- A man walks along the east-west street, and a graph of his displacemen...
Text Solution
|
- In the following velocity time graph of a body the distance travelled ...
Text Solution
|
- A body is projected vertically upward from the surface of the earth, t...
Text Solution
|
- A rocket is launched upward from the earth surface whose velocity time...
Text Solution
|
- The covered height by the rocket before retardation is :
Text Solution
|
- A particle starts from rest and moves with constant acceleration. Then...
Text Solution
|
- For body of 50 kg. mass, the velocity time graph is shown in figure. T...
Text Solution
|
- Figure below shows the velocity-time graph of a one dimensional motion...
Text Solution
|