Home
Class 12
CHEMISTRY
Which plot is the adsorption isobar for ...

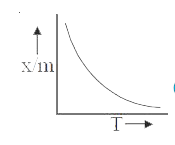
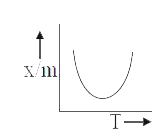
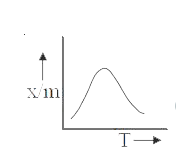
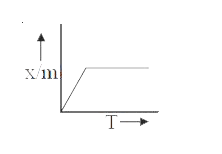
Which plot is the adsorption isobar for chemisorption?

A

B

C

D

Text Solution

AI Generated Solution

The correct Answer is:
To determine which plot represents the adsorption isobar for chemisorption, we need to analyze the relationship between the extent of adsorption and temperature while keeping pressure constant. Here's a step-by-step breakdown of the solution: ### Step-by-Step Solution: 1. **Understanding Adsorption Isobar**: - An isobar is a plot that represents a process at constant pressure. In the context of adsorption, it shows how the extent of adsorption varies with temperature while keeping the pressure constant. 2. **Defining Variables**: - Let \( x \) represent the amount of substance adsorbed. - Let \( m \) represent the mass of the adsorbent (the surface on which adsorption occurs). - The ratio \( \frac{x}{m} \) represents the extent of adsorption. 3. **Chemisorption Characteristics**: - Chemisorption involves the formation of strong chemical bonds between the adsorbate (the substance being adsorbed) and the adsorbent. - Initially, as temperature increases, the kinetic energy of the adsorbate molecules increases, leading to an increase in the extent of adsorption. 4. **Behavior with Temperature**: - At lower temperatures, more adsorbate molecules can be adsorbed as they form strong bonds with the adsorbent. - As the temperature continues to rise, the extent of adsorption initially increases but eventually decreases due to the saturation of adsorption sites and the strong bonds already formed. 5. **Plotting the Curve**: - The expected plot for chemisorption will show an initial increase in the extent of adsorption with temperature, followed by a decrease after reaching a certain point. - This results in a curve that rises and then falls, indicating that there is an optimal temperature range for adsorption. 6. **Identifying the Correct Option**: - Among the given options, the plot that shows this characteristic behavior (initial increase followed by a decrease) is the correct answer. - Based on the analysis, this corresponds to **Option 3**. ### Conclusion: The correct plot representing the adsorption isobar for chemisorption is **Option 3**, which illustrates the initial increase in adsorption with temperature followed by a decrease. ---
Promotional Banner

Topper's Solved these Questions

  • SURFACE CHEMISTRY

    VMC MODULES ENGLISH|Exercise IN CHAPTER-C|6 Videos
  • SURFACE CHEMISTRY

    VMC MODULES ENGLISH|Exercise IN CHAPTER-D|9 Videos
  • SURFACE CHEMISTRY

    VMC MODULES ENGLISH|Exercise IN-CHAPTER-A|10 Videos
  • STRUCTURE OF ATOM

    VMC MODULES ENGLISH|Exercise IN-CHAPTER EXERCISE-F|7 Videos
  • THE SOLID STATE

    VMC MODULES ENGLISH|Exercise EXERCISE-J|10 Videos

Similar Questions

Explore conceptually related problems

Which is not adsorption isobar for chemisorption?

select correct absorption isobars for chemisoption and physisoption respectivly , (where x/m = extent of adsorption , T = temperature )

Which one is not the characteristic of chemisorption:

The rate of chemisorption :

What is meant by chemisorption?

Which one of the following is incorrect for chemisorption?

Which of the following is true with respect to chemical adsorption (chemisorption)?

What do you understand by adsorption isotherm and adsorption isobar ? Explain Freundlich adsorption isotherm for the adsorption of gases on solids.

Define adsorption. Write any two features which distinguish physisorption from chemisorption.

Which statement is incorrect for chemisorption?