A
B
C
D
Text Solution
Verified by Experts
The correct Answer is:


Topper's Solved these Questions
Similar Questions
Explore conceptually related problems
VMC MODULES ENGLISH-MOCK TEST 2-PART I : PHYSICS (SECTION - 2)
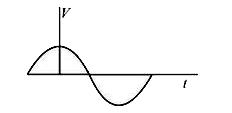
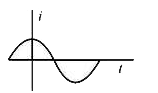
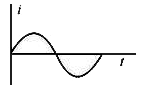
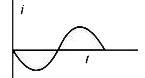
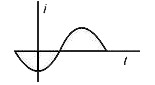
- Voltage across a capacitor varies as shown in the diagram. Which diagr...
Text Solution
|
- Coefficient of thermal expansion of a wire varies with temperature T a...
Text Solution
|
- Two discs of moment of inertia 9kgm^2 and 3kgm^2were rotating with ang...
Text Solution
|
- A block of mass 10 kg is placed on rough inclined plane of inclinatio...
Text Solution
|
- A lens is placed between a source of light and screen. It forms real i...
Text Solution
|
- Calculate the force required to separate the glass plates of area 10^(...
Text Solution
|
- A source of sound S is moving with a velocity of 50 m/s towards a stat...
Text Solution
|
- When a light ray is incident on a medium of refractive index 4/3, refl...
Text Solution
|
- The magnetic field intensity due to a very small bar magnet having mag...
Text Solution
|
- A uniformly charged solid sphere having charge –9 coulomb and radius R...
Text Solution
|
- An object is moving towards a moving mirror as shown in the figure. Fi...
Text Solution
|