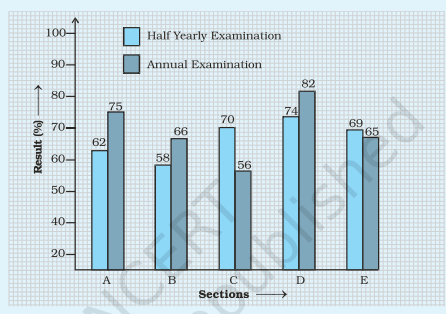
The double bar graph given below compares the
class-averages in half yearly and annual examinations
of 5 sections of Class VII.
Can you compare the ratio of difference of results of sections B and D ?
Topper's Solved these Questions
DATA HANDLING
NCERT EXEMPLAR|Exercise EXERCISE|42 Videos
COMPARING QUANTITIES
NCERT EXEMPLAR|Exercise THINK AND DISCUSS|24 Videos
EXPONENTS AND POWERS
NCERT EXEMPLAR|Exercise EXERCISE|136 Videos
Similar Questions
Explore conceptually related problems
The double bar graph given below compares the class-averages in half yearly and annual examinations of 5 sections of Class VII. Observe the graph carefully and tell which section showed the most improvement and by how much?
The average mathematics marks of two Sections A and B of Class IX in the annual examination is 74. The average marks of Section A is 77.5 and that of Section B is 70. The ratio of the number of students of Section A and B is
Given below is the result of an annual examination of a class, showing the percentage of students in each category . Represent the above data by a pie chart.
Study the double bar graph given below and answer the questions that follow: (a) What information is compared in the above given double bar graph? (b) Calculate the ratio of minimum temperatures in the year 2008 to the year 2009 for the month of November. (c) For how many months was the minimum temperature in the year 2008 greater than that of year 2009? Name those months. (d) Find the average minimum temperature for the year 2008 for the four months. (e) In which month is the variation in the two temperatures maximum?
The given pictograph represents the number of students in 5 sections of class VI. Study the given pictograph and answer the following questions. Find the difference between the number of students in section E and the total number of students in section C and D together.