A
B
C
D
Text Solution
Verified by Experts


Similar Questions
Explore conceptually related problems
Recommended Questions
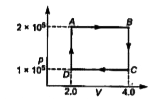
- The p-V diagram of a gas undergoing a cyclic process (ABCDA) is sho...
Text Solution
|
- An ideal gas underoges cyclic process of ABCDA as shown in Given P-V d...
Text Solution
|
- The P-V diagram of a gas undergoing a cyclic process ABCDA is shown in...
Text Solution
|
- The P-V diagram of a gas system undergoing cyclic process is shown her...
Text Solution
|
- An ideal gas undergoes cyclic process ABCDA as shown in givend p-V dia...
Text Solution
|
- One mole of an ideal gas undergoes a cyclic process ABCDA as shown in ...
Text Solution
|
- An ideal gas undergoes a cyclic process as shown in the given P-T diag...
Text Solution
|
- The P-V diagram of a gas undergoing a cyclic process ABCDA is shown in...
Text Solution
|
- An ideal gas undergoes cyclic process ABCDA as shown in given P - V di...
Text Solution
|