


Topper's Solved these Questions
Similar Questions
Explore conceptually related problems
PSEB-Data handling-EXAMPLES
- Find the mean of the first five whole numbers.
Text Solution
|
- A cricketer scores the following runs in eight innings: 58, 76, 40, ...
Text Solution
|
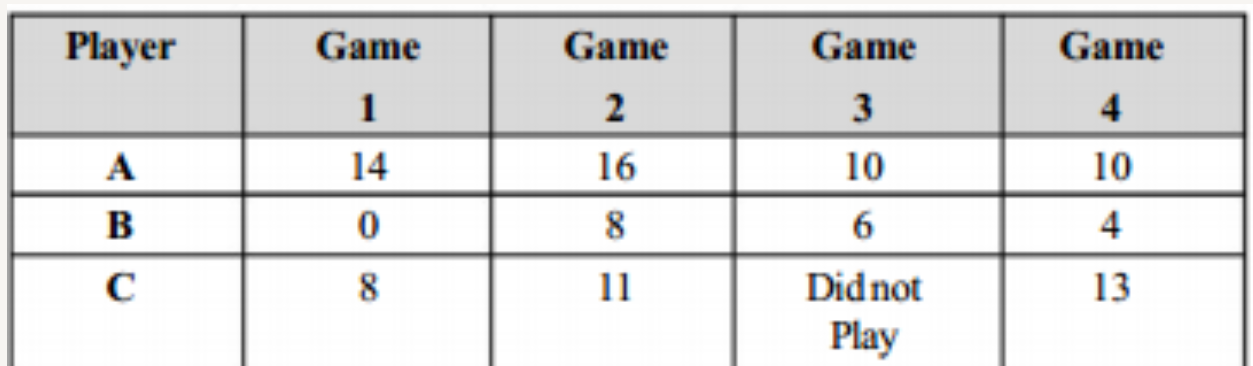
- Following table shows the points of each player scored in four games: ...
Text Solution
|
- Following table shows the points of each player scored in four games: ...
Text Solution
|
- Following table shows the points of each player scored in four games: ...
Text Solution
|
- Following table shows the points of each player scored in four games: ...
Text Solution
|
- The marks (out of 100) obtained by a group of students in a science te...
Text Solution
|
- The marks (out of 100) obtained by a group of students in a science te...
Text Solution
|
- The marks (out of 100) obtained by a group of students in a science te...
Text Solution
|
- The enrolment in a school during six consecutive years was as follows:...
Text Solution
|
- The rainfall (in mm) in a city on 7 days of a certain week was recorde...
Text Solution
|
- The rainfall (in mm) in a city on 7 days of a certain week was recorde...
Text Solution
|
- The rainfall (in mm) in a city on 7 days of a certain week was recorde...
Text Solution
|
- The heights of 10 girls were measured in cm and the results are as fol...
Text Solution
|
- The heights of 10 girls were measured in cm and the results are as fol...
Text Solution
|
- The heights of 10 girls were measured in cm and the results are as fol...
Text Solution
|
- The heights of 10 girls were measured in cm and the results are as fol...
Text Solution
|
- The heights of 10 girls were measured in cm and the results are as fol...
Text Solution
|
- Find the mode of the given set of numbers: 1, 1, 2, 4, 3, 2, 1, 2, 2, ...
Text Solution
|
- Following are the margins of victory in the football matches of a leag...
Text Solution
|