


PSEB-Data handling-EXAMPLES
- Tell whether the statement is true or false: The data 6,4,3,8,9,12,1...
Text Solution
|
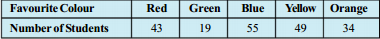
- Two hundred students of 6th and 7th classes were asked to name their f...
Text Solution
|
- Two hundred students of 6th and 7th classes were asked to name their f...
Text Solution
|
- Following data gives total marks (out of 600) obtained by six children...
Text Solution
|
- A mathematics teacher wants to see, whether the new technique of teach...
Text Solution
|
- Use the bar graph to answer the following questions. Which is the...
Text Solution
|
- Use the bar graph to answer the following questions. How many stu...
Text Solution
|
- Read the bar graph which shows the number of books sold by a bookstore...
Text Solution
|
- Read the bar graph which shows the number of books sold by a bookstore...
Text Solution
|
- Read the bar graph which shows the number of books sold by a bookstore...
Text Solution
|
- Read the bar graph which shows the number of books sold by a bookstore...
Text Solution
|
- Number of children in six different classes are given below. Represent...
Text Solution
|
- Number of children in six different classes are given below. Represent...
Text Solution
|
- Number of children in six different classes are given below. Represent...
Text Solution
|
- The performance of a student in 1^(st) Term and 2^(nd) Term is given. ...
Text Solution
|
- The performance of a student in 1^(st) Term and 2^(nd) Term is given. ...
Text Solution
|
- Consider this data collected from a survey of a colony. Draw a do...
Text Solution
|
- Consider this data collected from a survey of a colony. Which spo...
Text Solution
|
- Consider this data collected from a survey of a colony. Which is ...
Text Solution
|
- Take the data giving the minimum and the maximum temperature of variou...
Text Solution
|