 : Represent the given information with the help of a histogram.


Topper's Solved these Questions
Similar Questions
Explore conceptually related problems
PSEB-STATISTICS-EXAMPLE
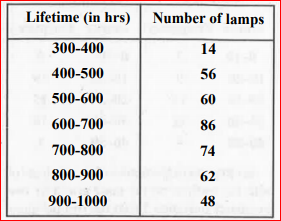
- The following table gives the life times of 400 neon lamps : : Rep...
Text Solution
|
- In a particular section of Class IX, 40 students were asked about the ...
Text Solution
|
- A family with monthly income of Rs. 20,000 had planned the following e...
Text Solution
|
- A teacher analyses the performance of two sections of students in a ma...
Text Solution
|
- In a city, the weekly observations made in a study on the cost of livi...
Text Solution
|
- 5 people were asked about the time in a week they spend in doing socia...
Text Solution
|
- Consider the marks obtained (out of 100 marks) by 30 students of Class...
Text Solution
|
- The heights (in cm) of 7 students of a class are as follows:162, 164, ...
Text Solution
|
- The points scored by a Kabaddi team in a series of matches are as foll...
Text Solution
|
- Find the mode of the following marks (out of 10) obtained by 20 studen...
Text Solution
|
- Consider a small unit of a factory where there are 5 employees : a sup...
Text Solution
|