


Topper's Solved these Questions
Similar Questions
Explore conceptually related problems
PSEB-STATISTICS-EXAMPLE
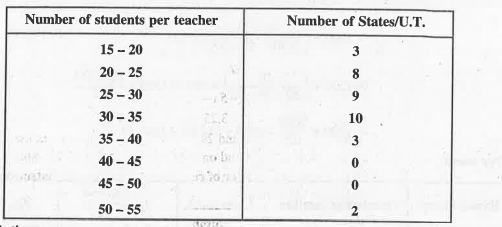
- The following distribution gives the state-wise teacher-student ratio ...
Text Solution
|
- The table below gives the percentage distribution of female teachers i...
Text Solution
|
- The distribution below shows the number of wickets taken by bowlers in...
Text Solution
|
- The wickets taken by a bowler in 10 cricket matches are as follows, 2 ...
Text Solution
|
- A survey conducted on 20 households in a locality by a group of studen...
Text Solution
|
- A survey regarding the heigths (in cm) of 51 girls of Class X of a sch...
Text Solution
|
- The median of the following data is 525. Find the values of x and y, i...
Text Solution
|
- The annual profits earned by 30 shops of a shopping complex in a local...
Text Solution
|