Text Solution
Verified by Experts


Topper's Solved these Questions
Similar Questions
Explore conceptually related problems
NAGEEN PRAKASHAN ENGLISH-STATISTICS-MISCELLANEOUS EXERCISE
- The mean and variance of eight observations are 9 and 9.25, respect...
Text Solution
|
- The mean and variance of 7 observations are 8 and 16, respectively....
Text Solution
|
- The mean and standard deviation of six observations are 8 and 4, re...
Text Solution
|
- Given that barx is the mean and sigma^(2) is the variance of n observ...
Text Solution
|
- The mean and standard deviation of 20 observations are found to be 1...
Text Solution
|
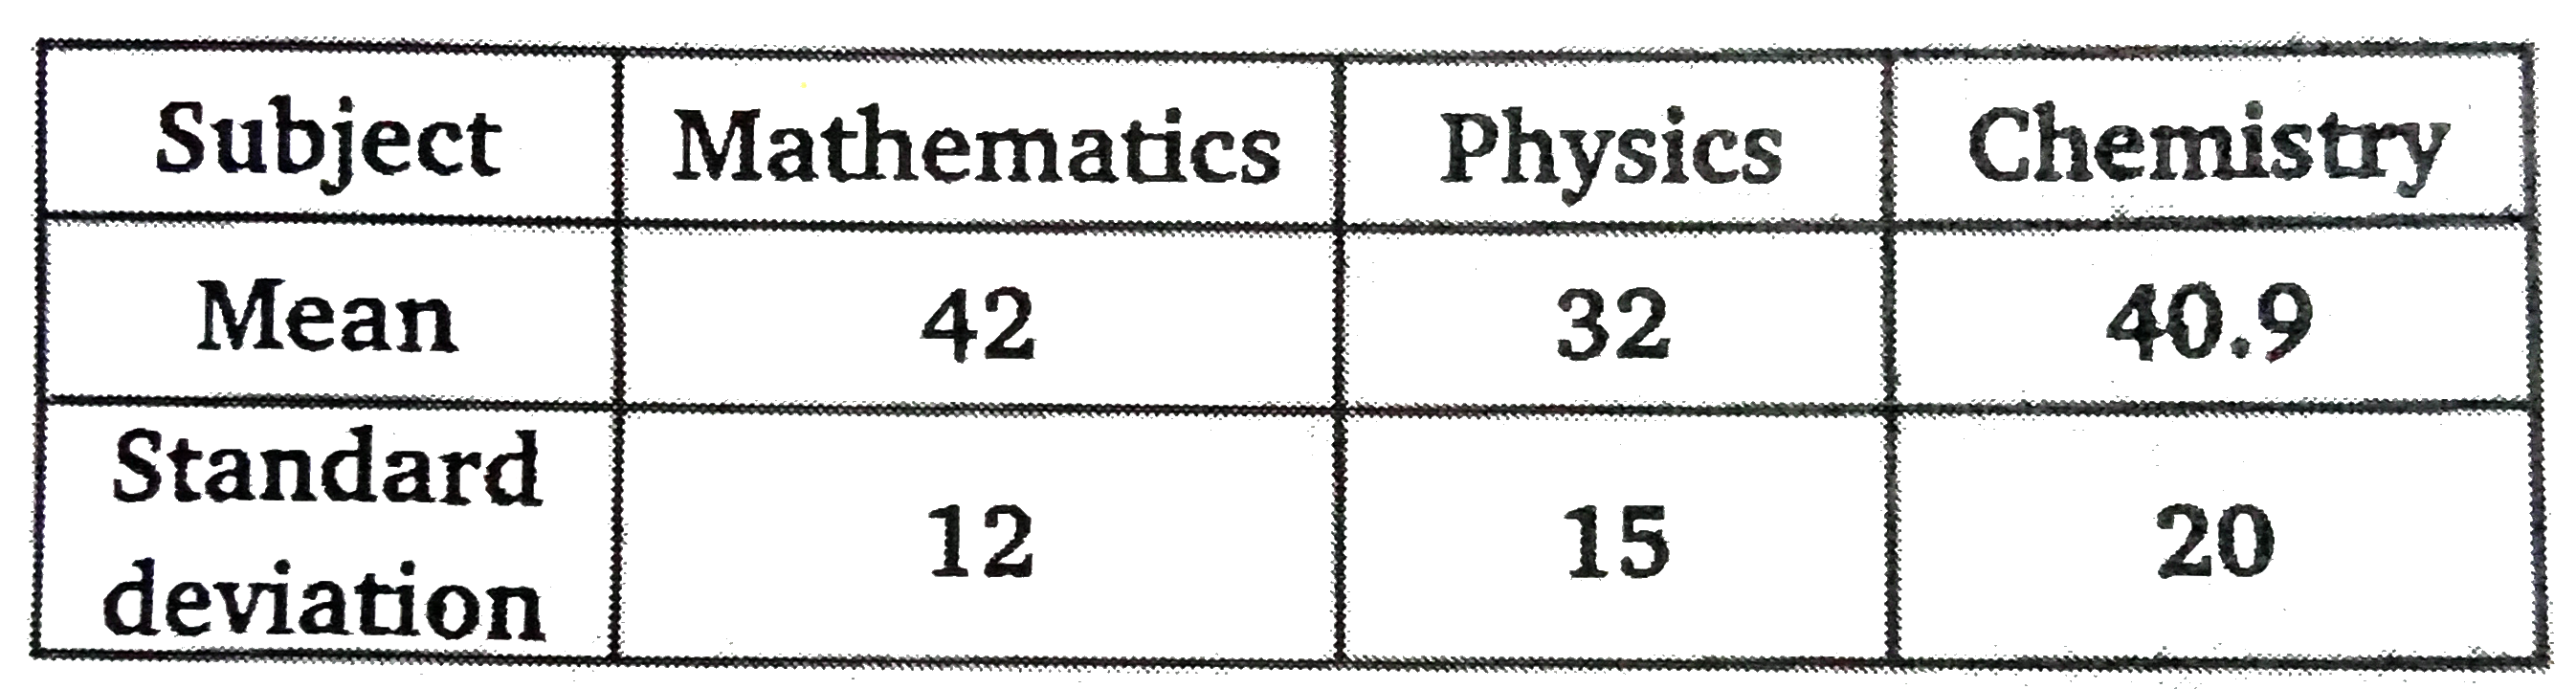
- The mean and standard deviation of marks obtained by 50 students of a ...
Text Solution
|
- The mean and standard deviation of a group of 100 observations were...
Text Solution
|