Text Solution
Verified by Experts


Topper's Solved these Questions
STATISTICS
NAGEEN PRAKASHAN ENGLISH|Exercise Problems From NCERT/exemplar|22 VideosSTATISTICS
NAGEEN PRAKASHAN ENGLISH|Exercise Exercise 14a|10 VideosQUADRILATERALS
NAGEEN PRAKASHAN ENGLISH|Exercise Revision Exercise (long Answer Questions)|5 VideosSURFACE AREA AND VOLUME
NAGEEN PRAKASHAN ENGLISH|Exercise Revision Exercise (long Answer Questions)|10 Videos
Similar Questions
Explore conceptually related problems
NAGEEN PRAKASHAN ENGLISH-STATISTICS-Revision Exercise
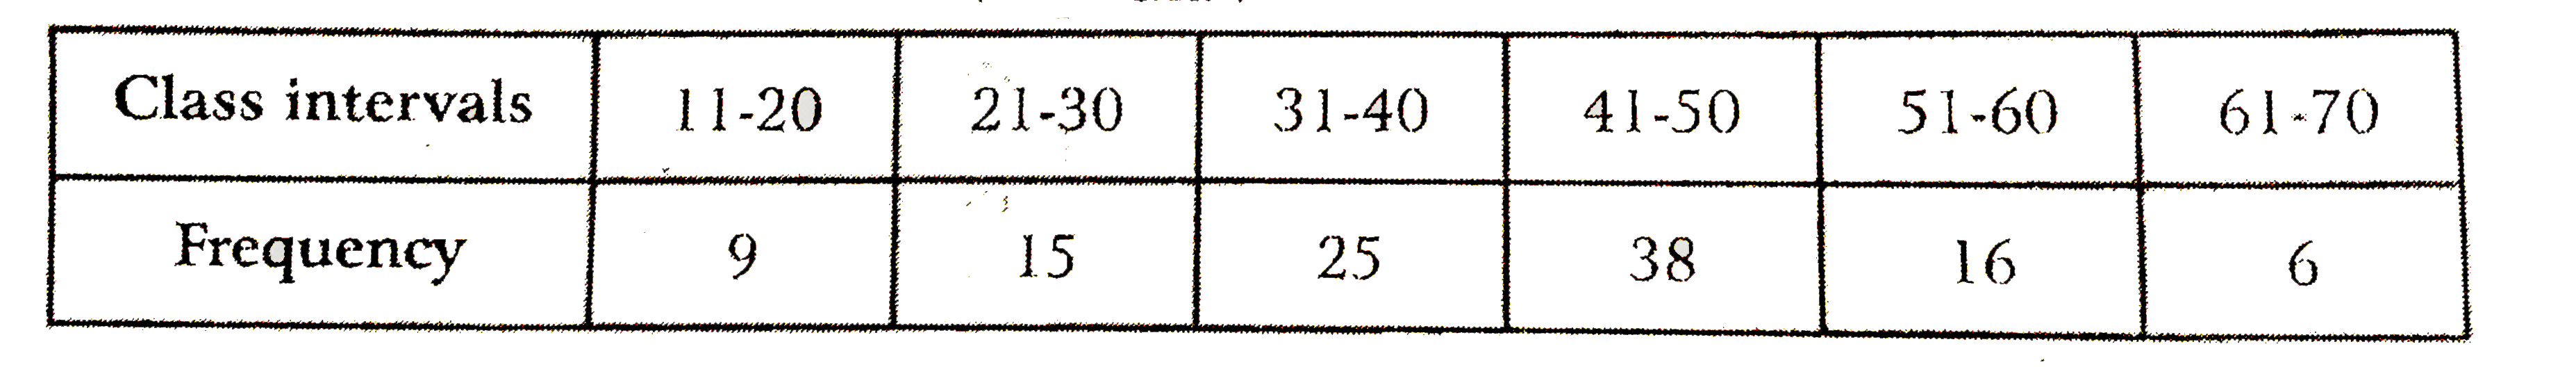
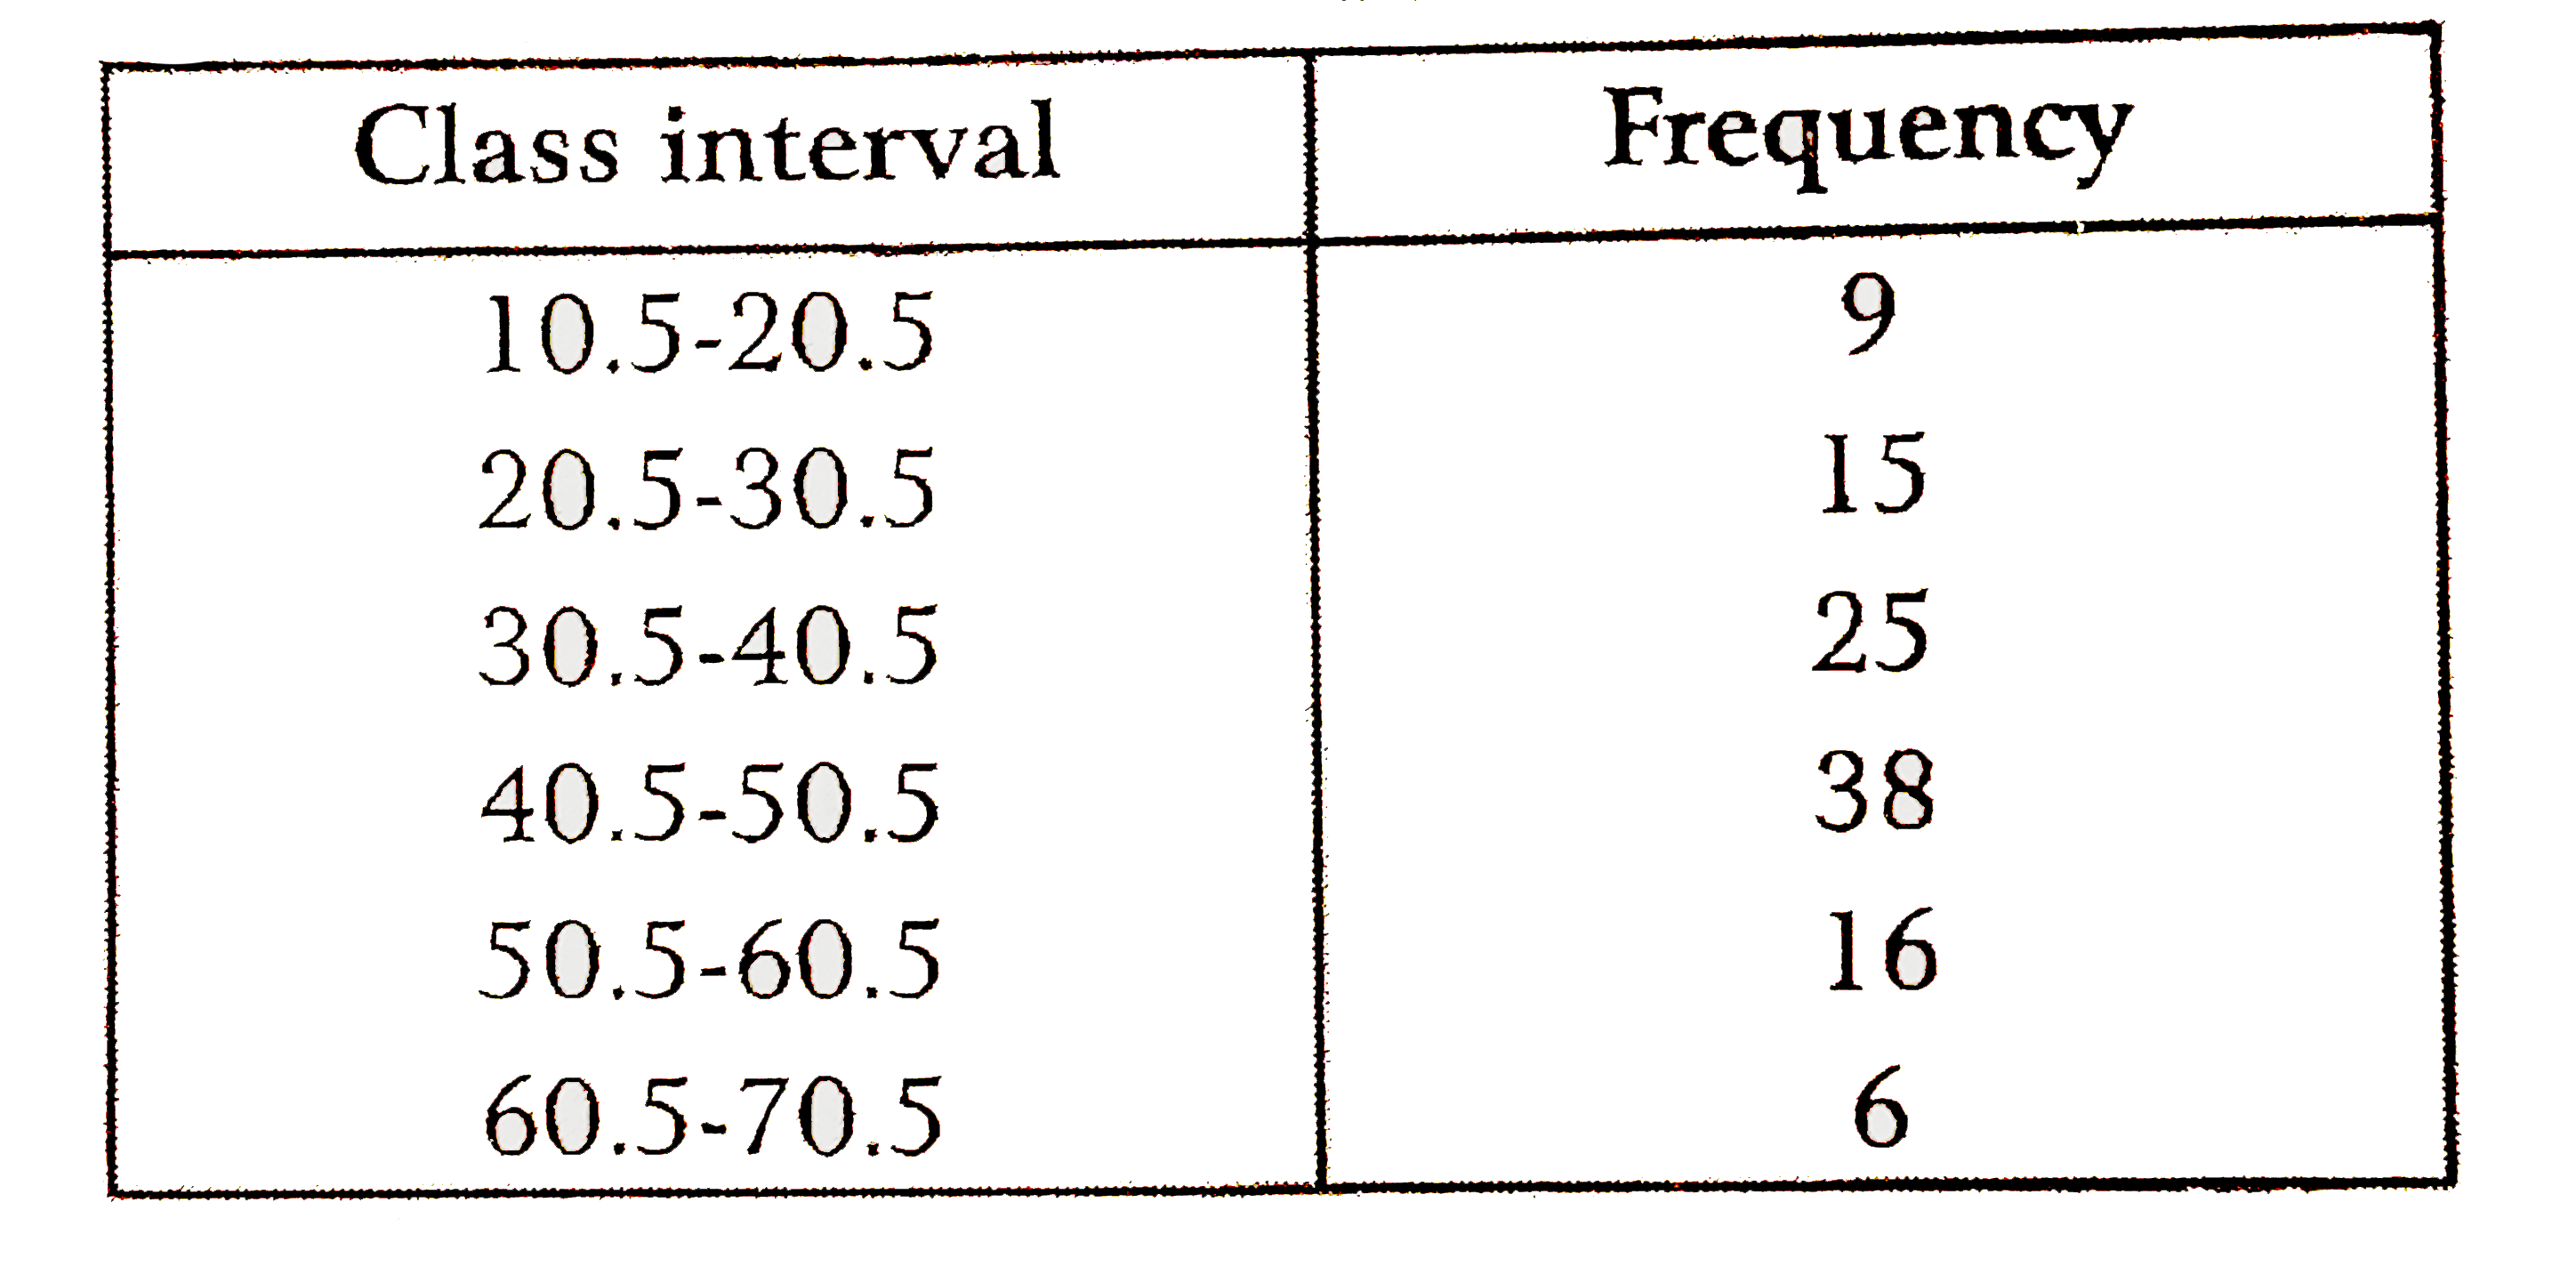
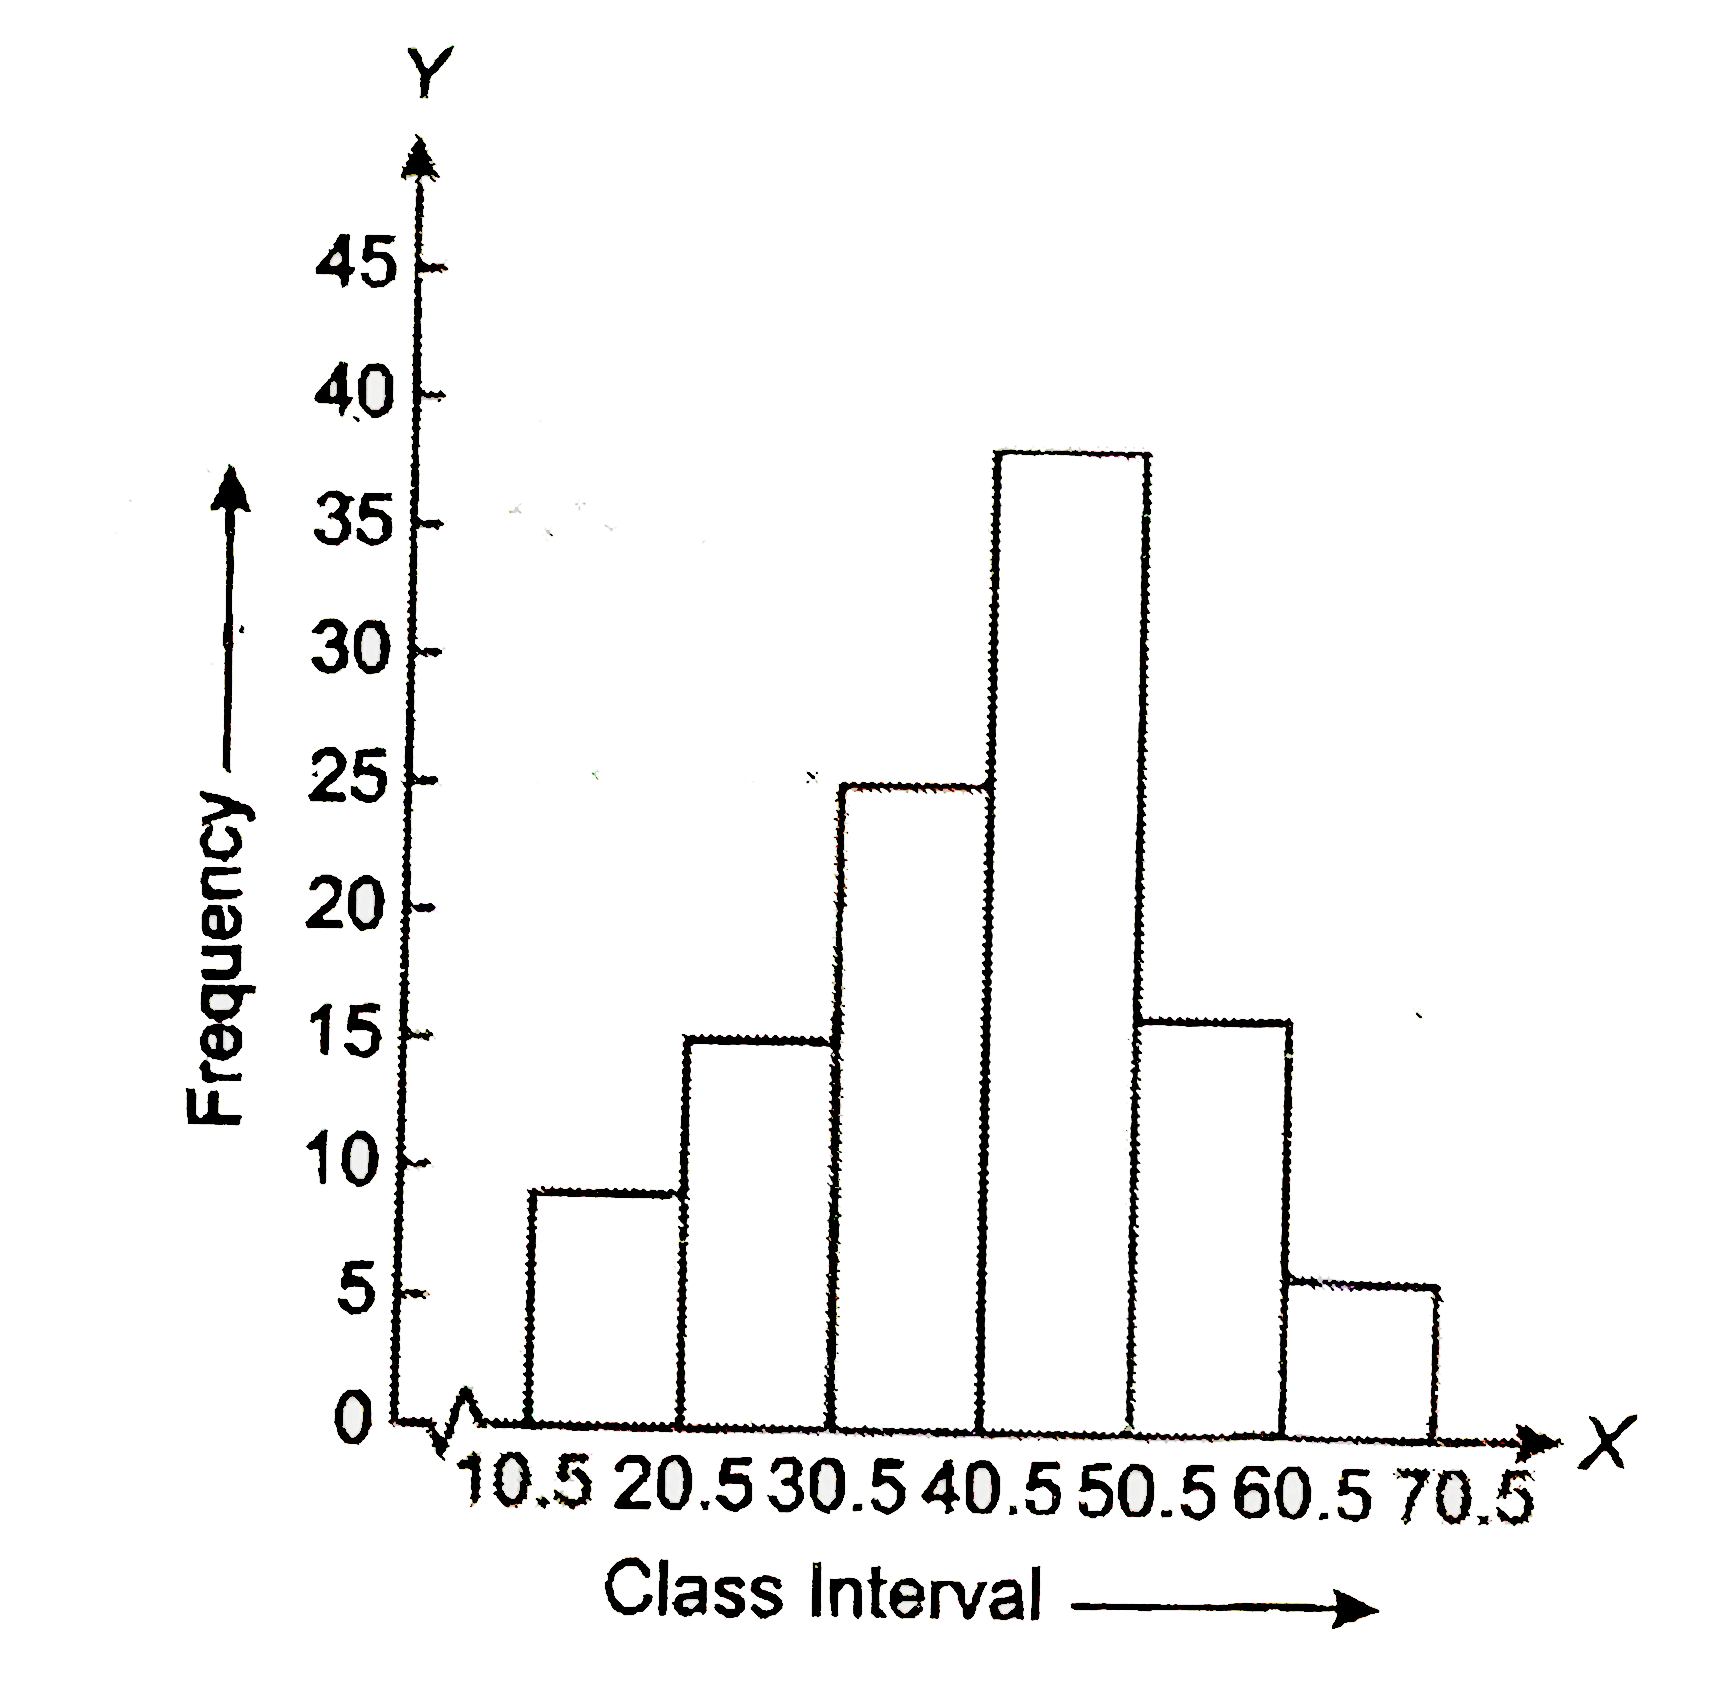
- Draw a histogram from the following data:
Text Solution
|
- If the heights of 5 persons are 140 cm, 150 cm, 152 cm, 158 cm and ...
Text Solution
|
- Find the mean of x ,\ x+2,\ x+4,\ x+6,\ x+8
Text Solution
|
- Find the mean of the following distribution:
Text Solution
|
- Find the value of P if the mean of the following distribution is 7.5
Text Solution
|
- The mean weight of 120 students of a school is 52*75 kg. If the mean w...
Text Solution
|
- The runs scored by 12 numbers of a cricket team are 14, 30, 43, 42, 1...
Text Solution
|
- Find the median of the following distribution: 40, 49, 17, 68, 44, ...
Text Solution
|
- The median of the following observation 11, 12, 14, (x - 2), (x + 4), ...
Text Solution
|
- Find the mode of the following distribution 7, 9, 8, 11, 8, 12, 8, 9.
Text Solution
|
- The marks of 19 students in a test were as follows: 5, 6, 8, 9, 10, 11...
Text Solution
|
- In a school there are five sections of class IX. The number of student...
Text Solution
|
- Draw a histogram to represent the following: Also draw a frequen...
Text Solution
|