Home
Class 9
MATHS
The following table gives the distributi...

The following table gives the distribution of students of two sections according to the marks obtained by them

Represent the marks of the students of both the sections on the same graph by two frquency polygons. From the two polygons compare the performance of the two sections.

Text Solution

Verified by Experts

Here, we make modified tables by given data.
For section A,

For section B,

Now, required frequency polygon curves are:
Promotional Banner

Topper's Solved these Questions

  • STATISTICS

    NAGEEN PRAKASHAN ENGLISH|Exercise Exercise 14a|10 Videos
  • STATISTICS

    NAGEEN PRAKASHAN ENGLISH|Exercise EXERCISE 14B|13 Videos
  • STATISTICS

    NAGEEN PRAKASHAN ENGLISH|Exercise Revision Exercise|12 Videos
  • QUADRILATERALS

    NAGEEN PRAKASHAN ENGLISH|Exercise Revision Exercise (long Answer Questions)|5 Videos
  • SURFACE AREA AND VOLUME

    NAGEEN PRAKASHAN ENGLISH|Exercise Revision Exercise (long Answer Questions)|10 Videos

Similar Questions

Explore conceptually related problems

A long magnet is cut in two parts in such a way that the ratio of their lengths is 2:1. The retio of pole strengths of both the section is

Which of the following graphs represents the relationship between the force F between two point charges and the distance r between them :

A class of 50 students belonging to the Kindergraten is divided in two sections A and B , having students in the ratio 2:3 respectively. The average weight of the students of the entire calss is 40 Ibs. The average weight of the students of section A is 2 Ibs . less than that of the students B. What is the average weight of the students of section B ?

Marks obtained by 40 students in a short asssessment is given below, where a and b are two missing data. If the mean of the distribution is 7.2, find a and b.

Marks obtaind by 40 students in a short assessment is given below, where a and b are two missing data. If the mean of the distribution is 7.2 find a and b

Out of 100 students, two sections of 40 and 60 are formed. If you and your friend are among the 100 students, what is the probability that(a) you both enter the same section?(b) you both enter the different sections?

Out of 100 students two sections of 40 and 60 students are formed. If you and your friends are among the 100 students, what is the probability that i. You both enter the same section? ii. You both enter the different section?

The water flowing through the same tube having two different cross section areas has different flow rates .

The vessel shown in the figure has two sections of areas of cross-section A _ 1 and A _2 . A liquid of density rho fills both the section, up to a height h in each. Neglect atmospheric pressure. Choose correct options.

NAGEEN PRAKASHAN ENGLISH-STATISTICS-Problems From NCERT/exemplar
  1. A study was conducted to find out the concentration of sulphur dioxide...

    Text Solution

    |

  2. The value of pi upto 50 decimal places is given below 3.141592653589...

    Text Solution

    |

  3. The truth table given below represents

    Text Solution

    |

  4. The length of 40 leaves of a plant measured correct to one millimetre ...

    Text Solution

    |

  5. The following table gives the life times of 400 neon lamps: (i) Repr...

    Text Solution

    |

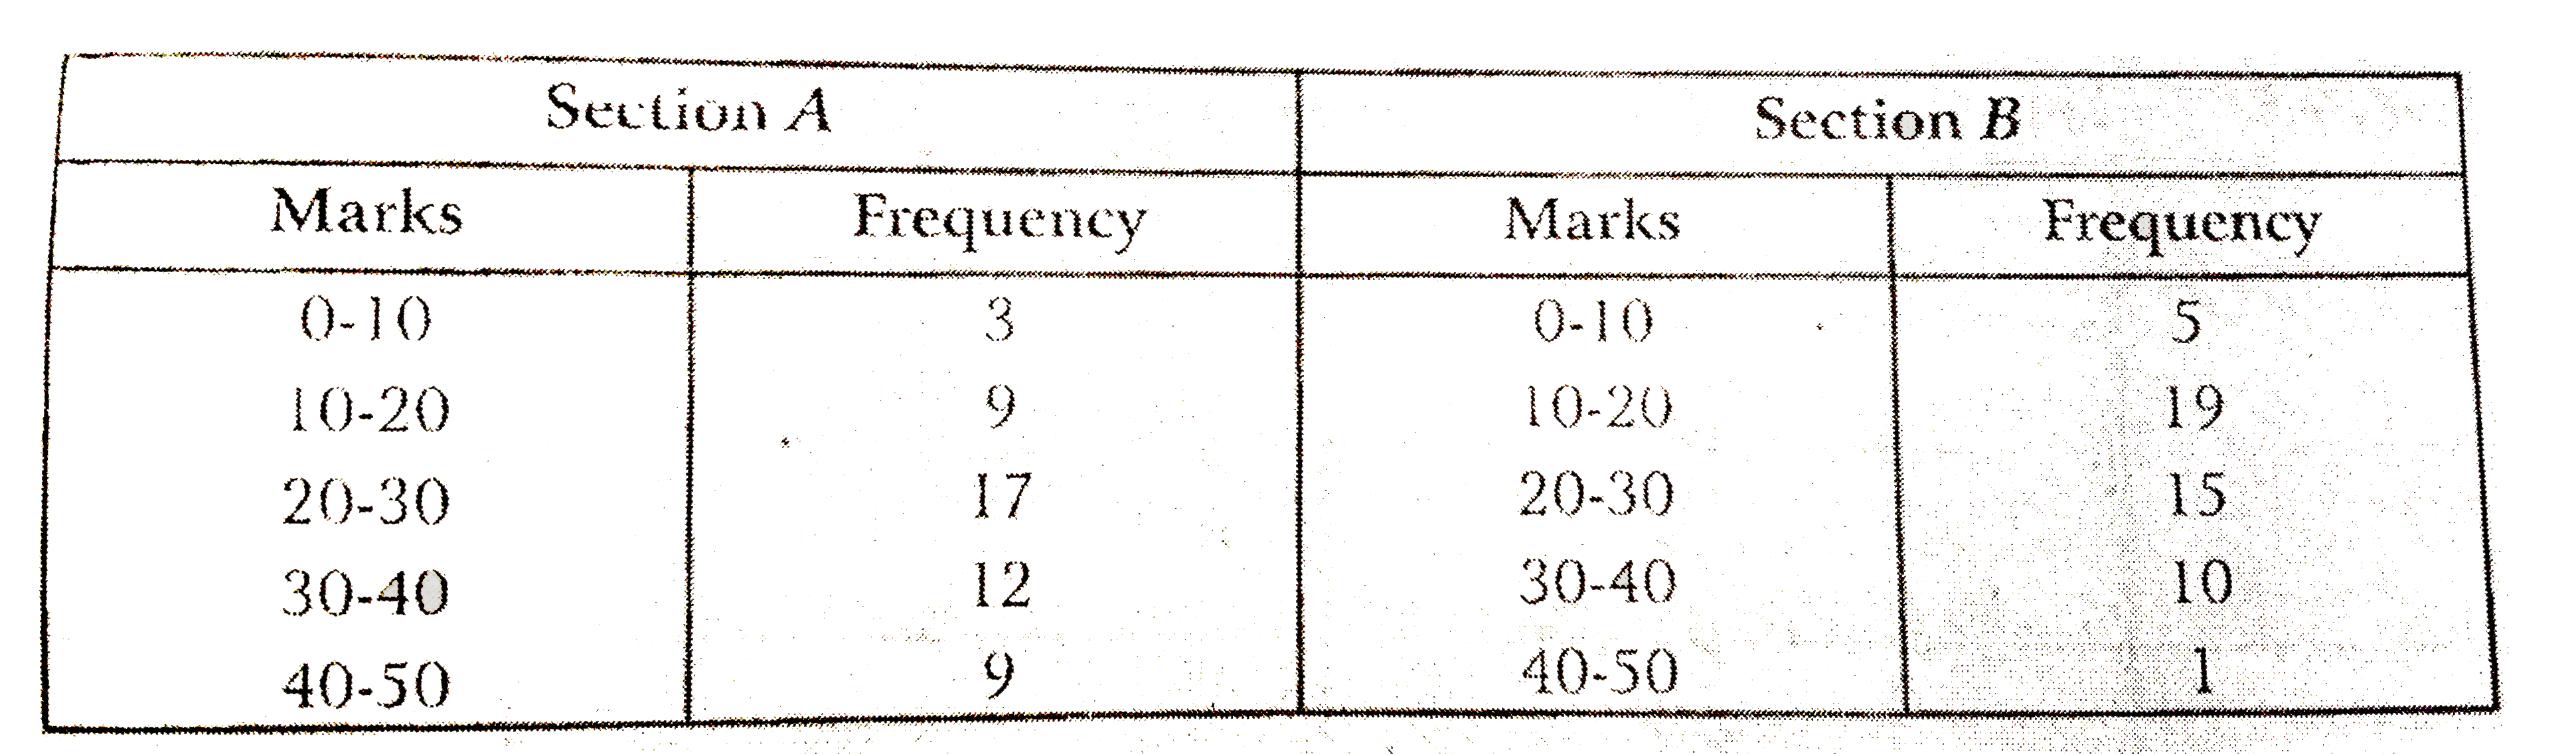
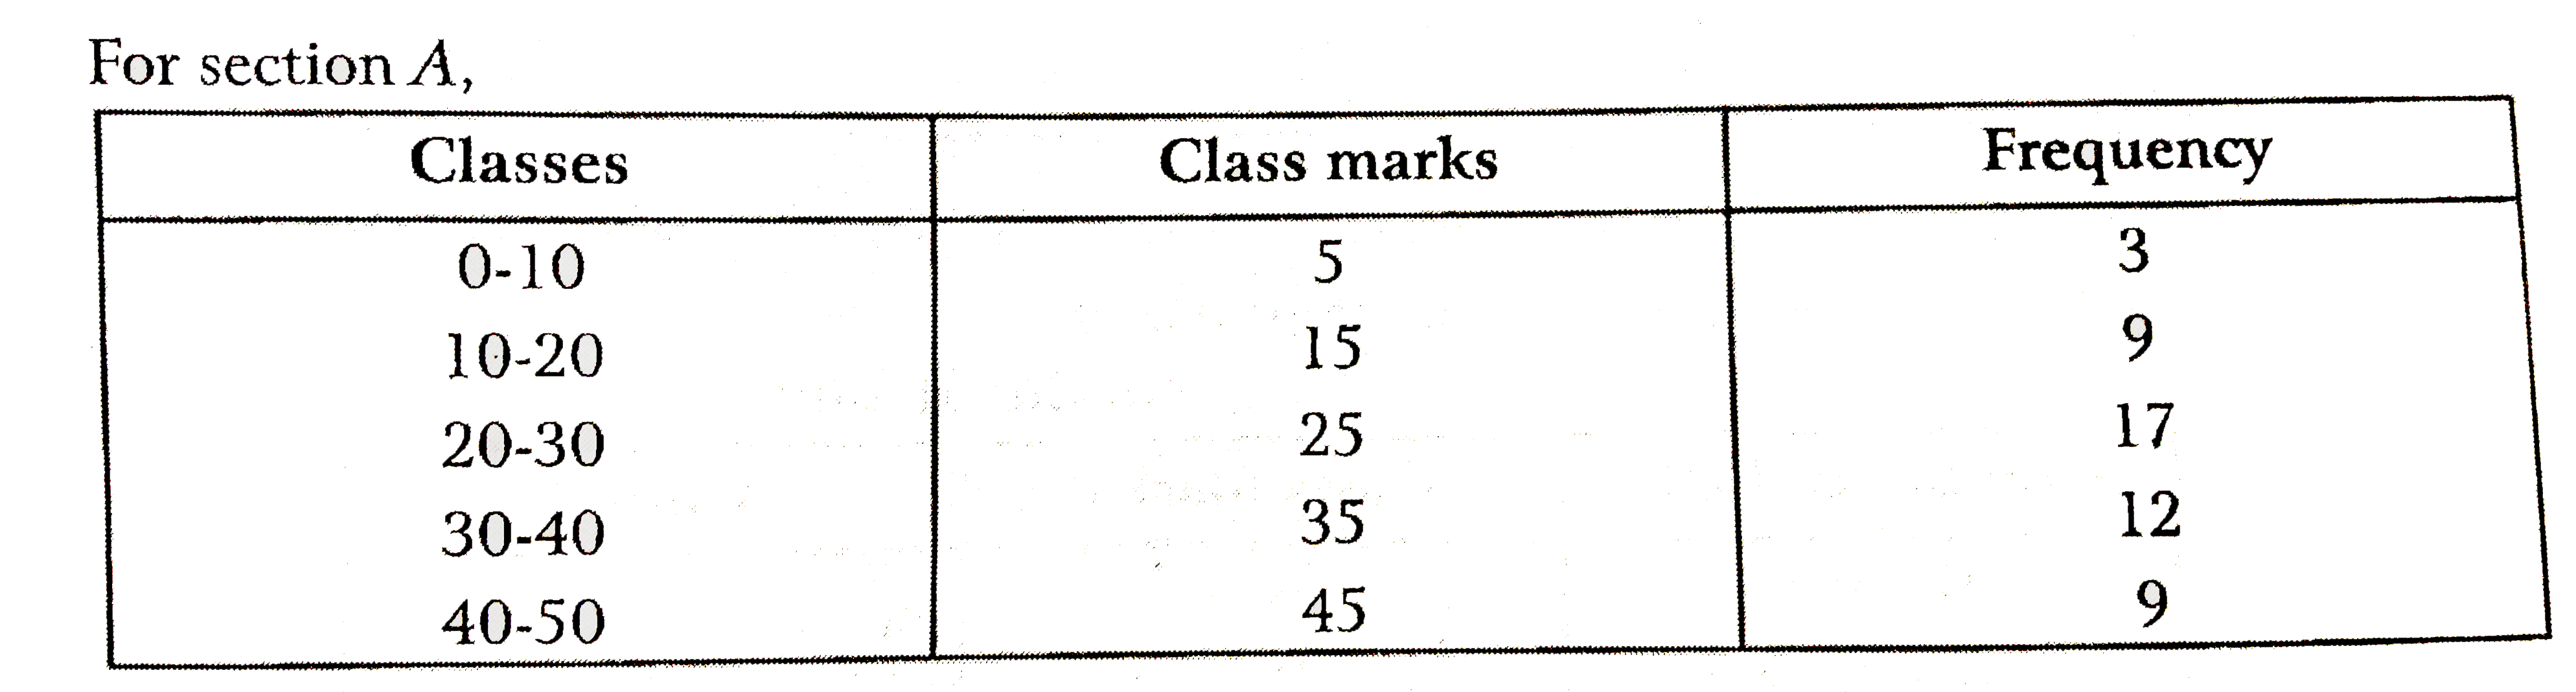
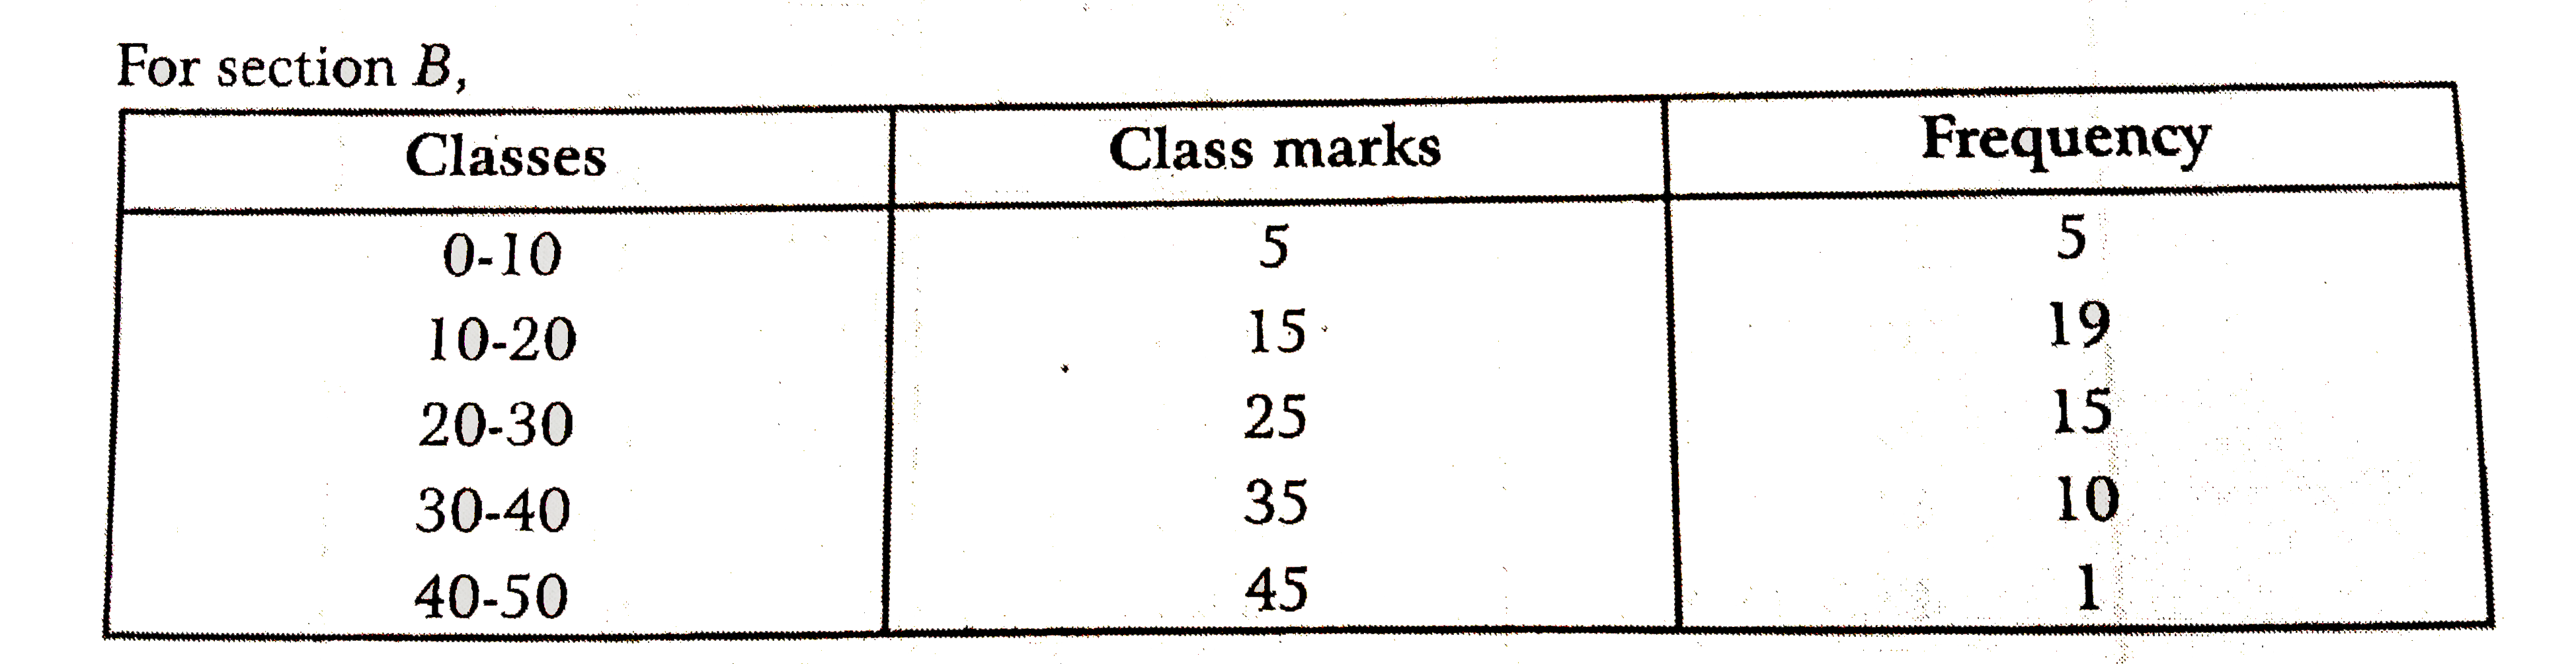
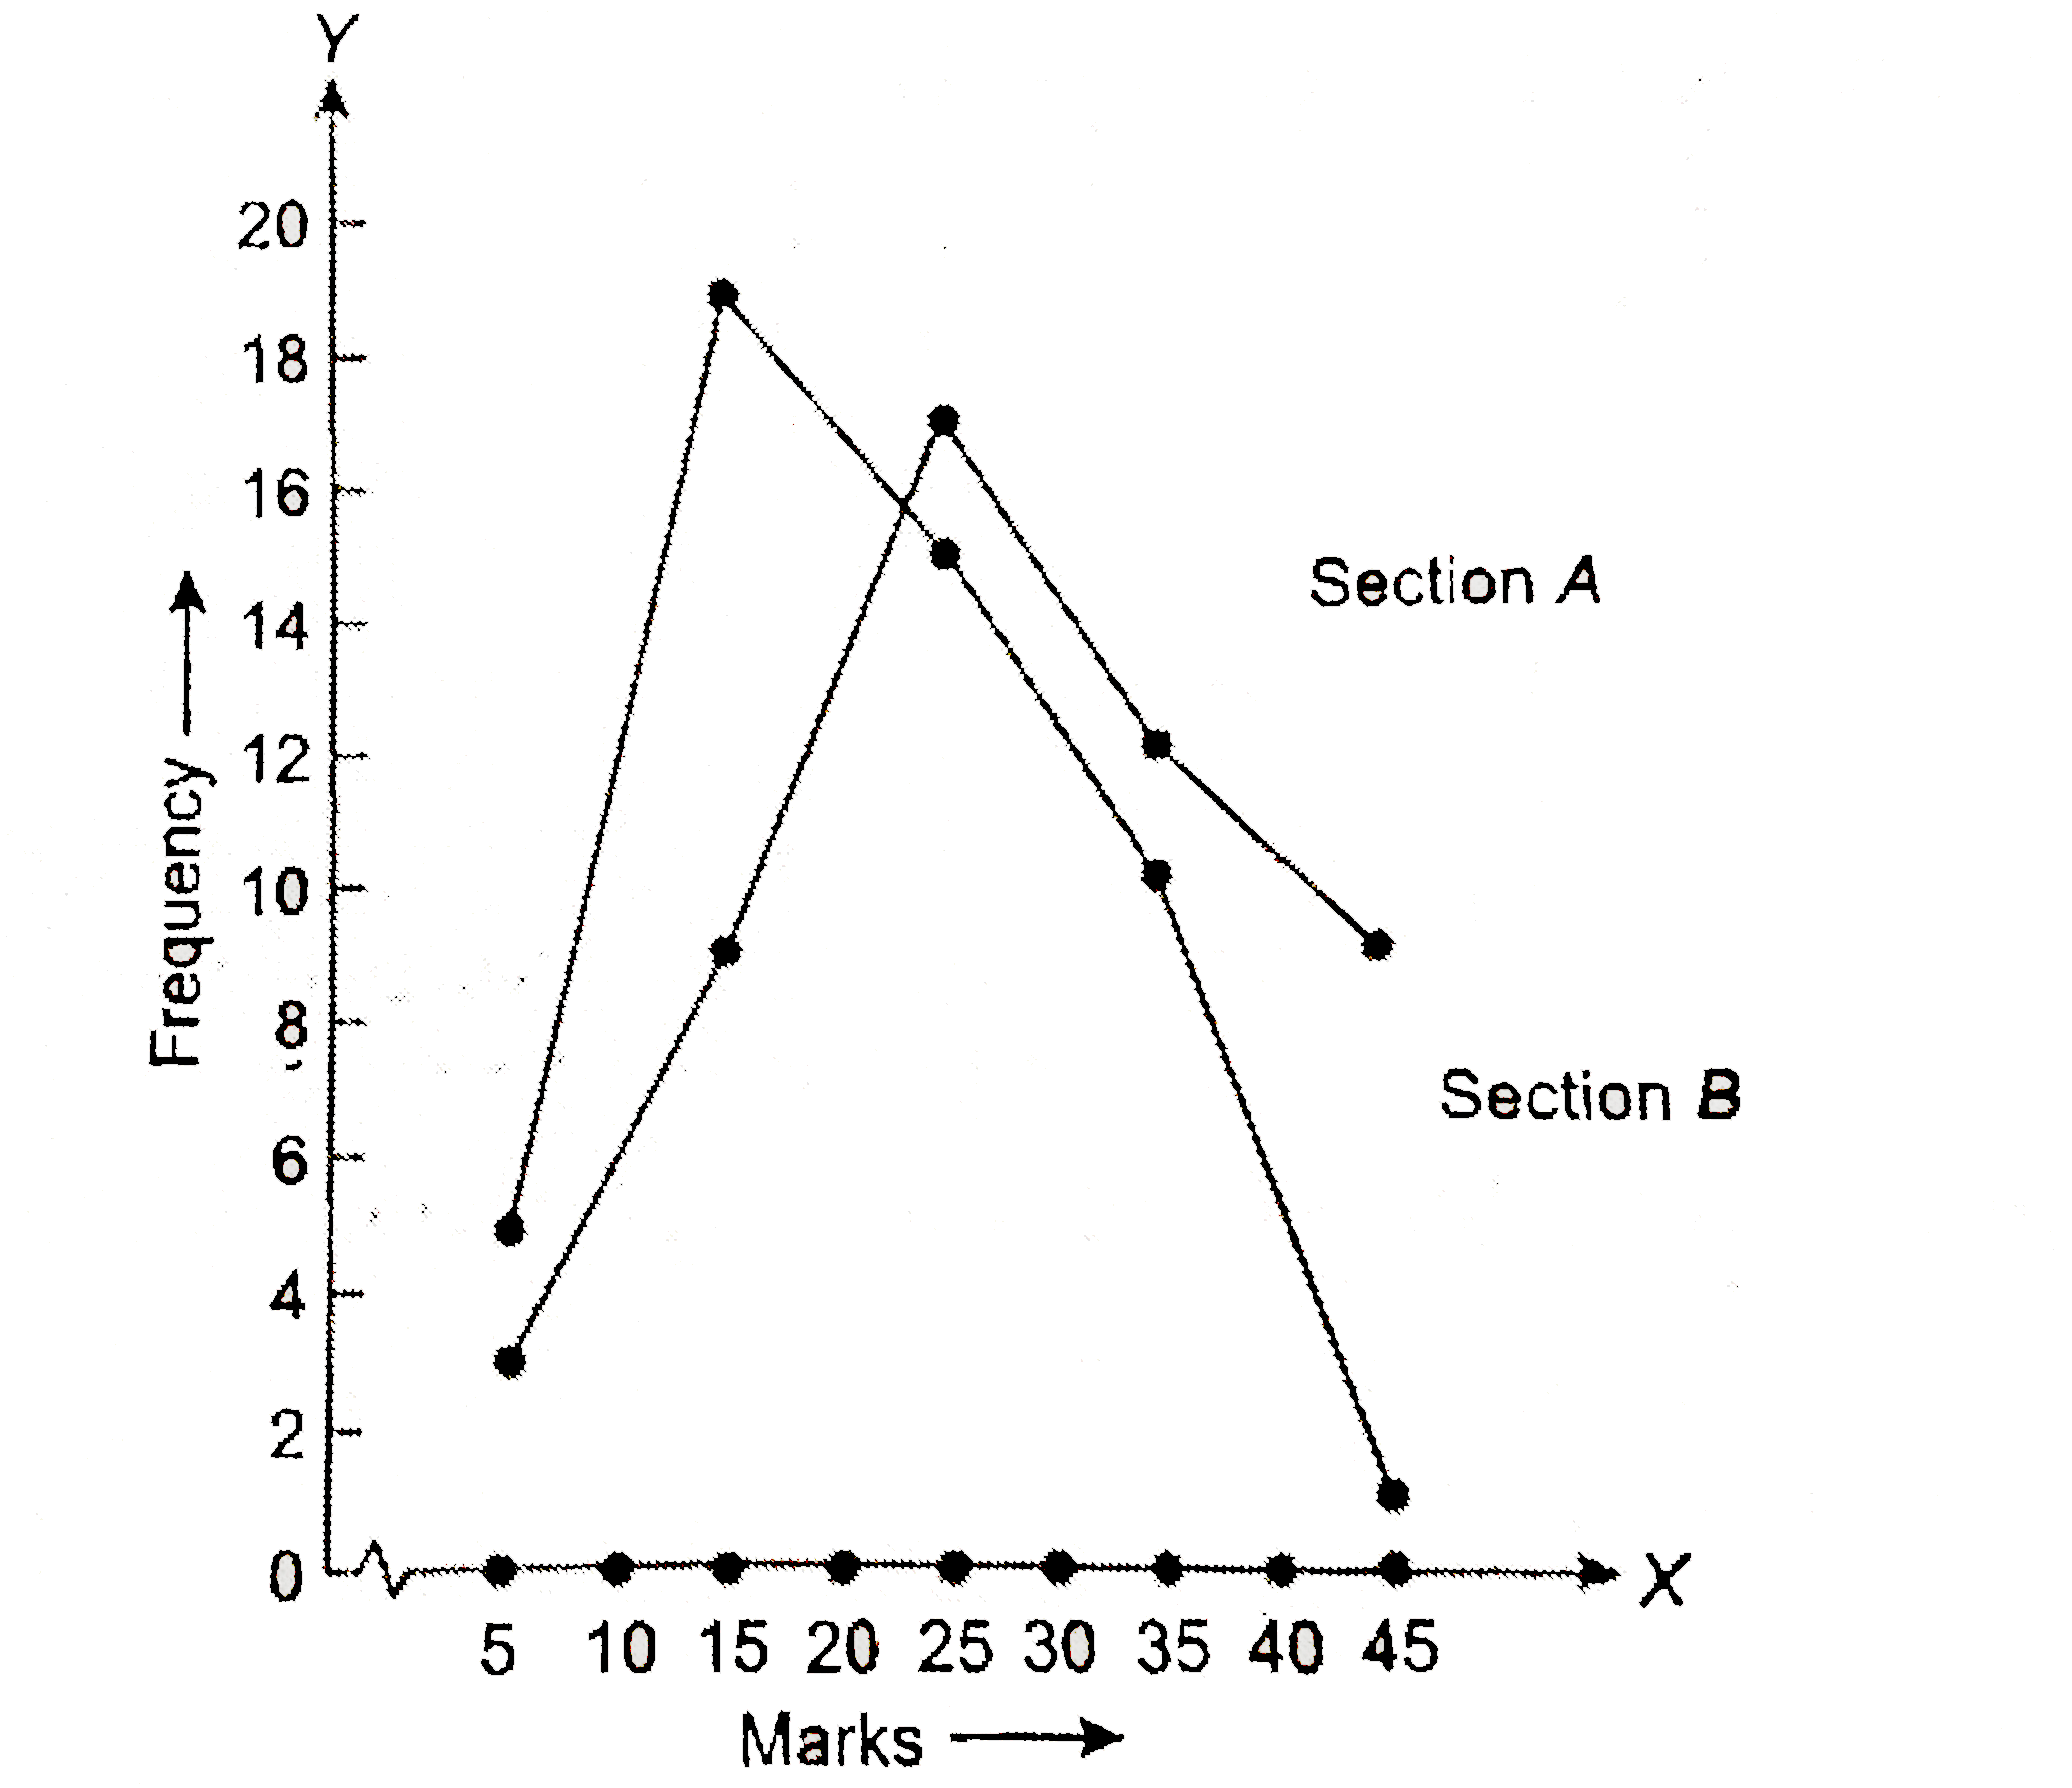
  6. The following table gives the distribution of students of two sections...

    Text Solution

    |

  7. The runs scored by two teams A and B on the first 60 balls in a cricke...

    Text Solution

    |

  8. A random survey of the number of children of various are groups playin...

    Text Solution

    |

  9. 100 surnames were randomly picked up from a local telephone directory ...

    Text Solution

    |

  10. The mean of five numbers is 30. If one number is excluded, their mean ...

    Text Solution

    |

  11. If the mean of the observation x, x+3, x+5, x+7 and x+10 is 9, then me...

    Text Solution

    |

  12. The mean deviation for n observations x1, x2, , xn from their mean ...

    Text Solution

    |

  13. If each observation of the data is increased by 5, then their mean

    Text Solution

    |

  14. Let barx be the mean of x(1), x(2), ………, x(n) and bary be the mean of ...

    Text Solution

    |

  15. If barx is the mean of x(1), x(2), …………., x(n), then for a ne 0, the m...

    Text Solution

    |

  16. If barx1,barx2,barx3,...barxn are the means of n groups with n1,n2,n3,...

    Text Solution

    |

  17. The mean of 100 observation is 50. If one of the observation which was...

    Text Solution

    |

  18. There are 50 numbers. Each number is subtracted from 53 and the mean o...

    Text Solution

    |

  19. The mean of 25 observation is 36. Out of these observations, if the me...

    Text Solution

    |

  20. The marks obtained (out of 100) by a class of 80 students are given be...

    Text Solution

    |