Home
Class 10
MATHS
Marks of 40 student in a test out of max...

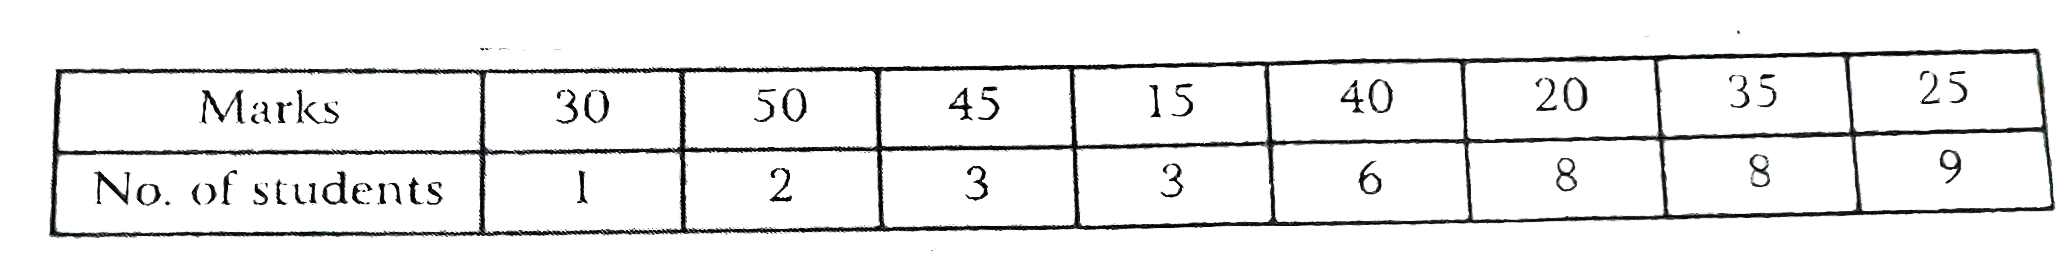
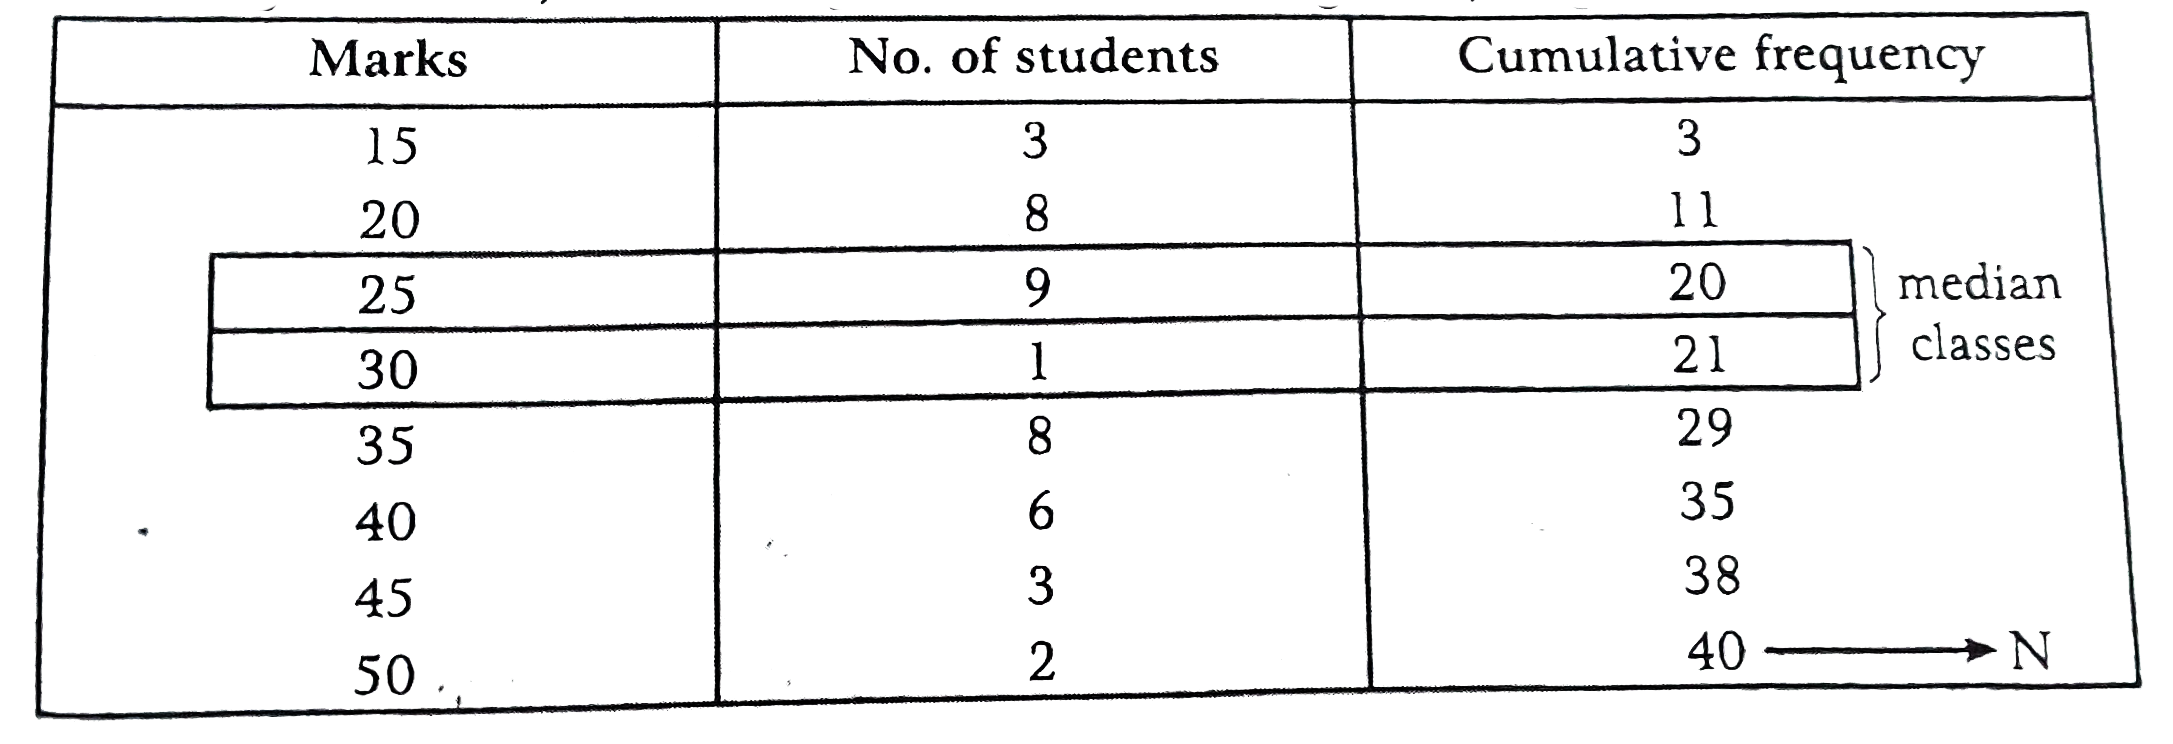
Marks of 40 student in a test out of maximum 50 marks are as follow :

Text Solution

Verified by Experts

To find the median, it is necessary to arrange the dat in ascending or desecending order of their magnitude. So, on arranging the data in ascending order, we get the following table :

Here N-40, which is even
`:. "Median"=((N)/(2)th "value"+((N)/(2)+1)the "value")/((40)/()th "value"+((40)/(2)+1)th "value")`
`=(20th "value" +21st "value")/(2)=(25+30)/(2)=27.5`
Promotional Banner

Topper's Solved these Questions

  • STATISTICS

    NAGEEN PRAKASHAN ENGLISH|Exercise Problems From NCERT/exemplar|4 Videos
  • STATISTICS

    NAGEEN PRAKASHAN ENGLISH|Exercise Exercise 14 A|17 Videos
  • SOME APPLICATIONS OF TRIGONOMETRY

    NAGEEN PRAKASHAN ENGLISH|Exercise Long Answer Questions|5 Videos
  • TRIANGLES

    NAGEEN PRAKASHAN ENGLISH|Exercise Revision Exercise Long Questions|1 Videos

Similar Questions

Explore conceptually related problems

In a class of 40 students, the marks obtained (out of 50) are as given below: Draw a histogram to represent the given data.

The marks of 12 students in a Math test are as follows: 8, 10, 4, 8, 5, 6, 9, 7, 6, 8, 9, 10 Find the: a maximum marks, b. minimum marks, c. range of marks, and d. mean marks.

The marks of some students were listed out of a maximum 75. The SD of marks was found to be 9. Subsequently the marks were raised to a maximum of 100 and variance of new marks was calculated. The new variance is (1)144 (2) 122 (3) 81 (4) None of these

The marks of some students were listed out of a maximum 75. The SD of marks was found to be 9. Subsequently the marks were raised to a maximum of 100 and variance of new marks was calculated. The new variance is 144 2. 122 3. 81 4. 256 5. 16

The frequency distribution of the marks obtained by 100 students in a test carrying 50 marks is given below. Then the mean is {:("Marks ",0-9,10-19,20-29,30-39,40-49),("No. of students "," "8," "15," "20," "45," "12):}

Following table shows the marks scored by a group of 90 students in a mathematics test of 100 marks. Marks 0-20 20-30 30-40 40-50 50-60 60-70 70-100 No. of Students: 7 10 10 20 20 15 8 Find the probability that marks scored by a student in the class is: at most 60 marks (ii) at least 60 marks (iii)not more than 50 marks

Marks of 10 students in an English test are as follow, 9,10,7,11,12,6,8,14,15,18 . Find. Maximum marks obtained

The frequency distribution of marks obtained by 28 students in a test carrying 40 marks is given below: {:("Marks":,0-10,10-20,20-30,30-40),("Number of students":,6,x,y,6):} If the mean of the above data is 20, then the difference between x and y is

Marks of 10 students in an English test are as follow, 9,10,7,11,12,6,8,14,15,18 . Find. Range of the marks

Marks of 10 students in an English test are as follow, 9,10,7,11,12,6,8,14,15,18 . Find mean marks