Text Solution
Verified by Experts


Topper's Solved these Questions
STATISTICS
NAGEEN PRAKASHAN ENGLISH|Exercise Exercise 14 A|17 VideosSTATISTICS
NAGEEN PRAKASHAN ENGLISH|Exercise Exercise 14 B|7 VideosSTATISTICS
NAGEEN PRAKASHAN ENGLISH|Exercise Revision Exercise Long Answer Questions|4 VideosSOME APPLICATIONS OF TRIGONOMETRY
NAGEEN PRAKASHAN ENGLISH|Exercise Long Answer Questions|5 VideosTRIANGLES
NAGEEN PRAKASHAN ENGLISH|Exercise Revision Exercise Long Questions|1 Videos
Similar Questions
Explore conceptually related problems
NAGEEN PRAKASHAN ENGLISH-STATISTICS -Problems From NCERT/exemplar
- To find out the concentration of SO(2) in the air (in parts per millio...
Text Solution
|
- In a retail market, fruit vendors were selling mangoes kept in packing...
Text Solution
|
- The given distribution shows the number of runs scored by some top b...
Text Solution
|
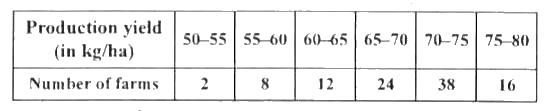
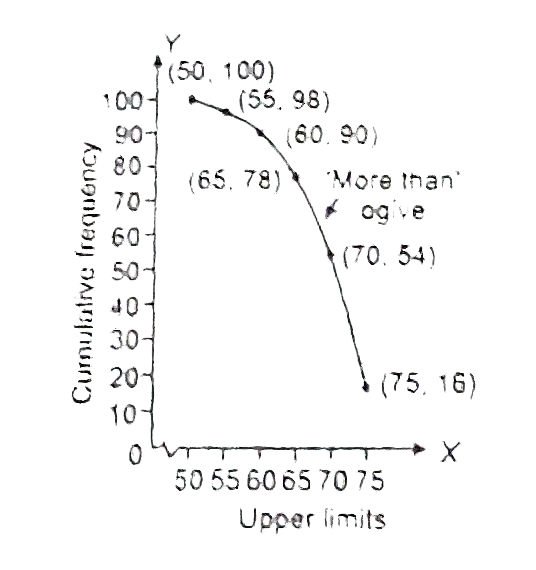
- The following table gives production yield per hectare of wheat of 100...
Text Solution
|