Text Solution
Verified by Experts
The correct Answer is:


Topper's Solved these Questions
STATISTICS
NAGEEN PRAKASHAN ENGLISH|Exercise Exercise 14 D|5 VideosSTATISTICS
NAGEEN PRAKASHAN ENGLISH|Exercise EXERCISE 14 E|5 VideosSTATISTICS
NAGEEN PRAKASHAN ENGLISH|Exercise Exercise 14 B|7 VideosSOME APPLICATIONS OF TRIGONOMETRY
NAGEEN PRAKASHAN ENGLISH|Exercise Long Answer Questions|5 VideosTRIANGLES
NAGEEN PRAKASHAN ENGLISH|Exercise Revision Exercise Long Questions|1 Videos
Similar Questions
Explore conceptually related problems
NAGEEN PRAKASHAN ENGLISH-STATISTICS -Exercise 14 C
- Find the mode of the following frequency distribution :
Text Solution
|
- Computer the mode for the following
Text Solution
|
- Given below is the frequency distribution of the heights of playces in...
Text Solution
|
- Find the mode of the following frequency distribution
Text Solution
|
- The following distributions represent the height of 160 studens of a c...
Text Solution
|
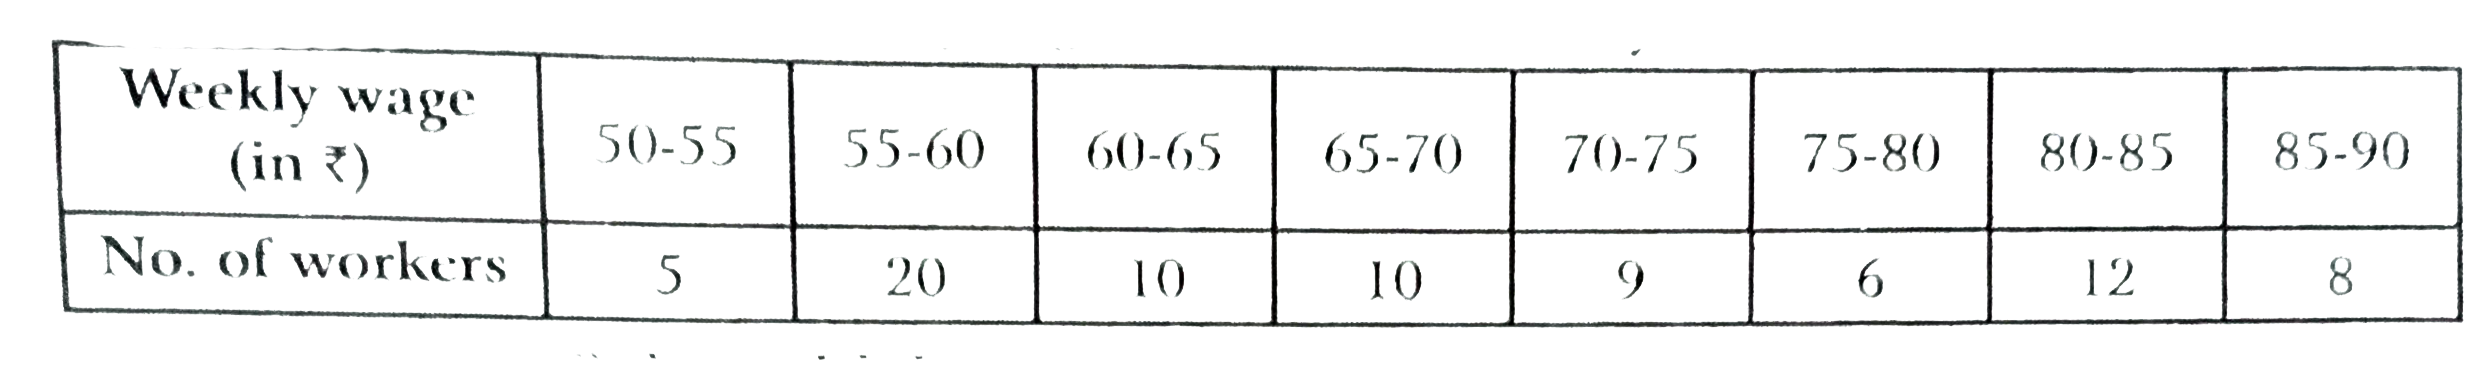
- The following table gives the weekly wage of workers in a factory: ...
Text Solution
|
- The following data gives the distribution of total household expendilt...
Text Solution
|
- The mode of the following series is 36. Find the missing frequency in ...
Text Solution
|
- Compute the mode of the following data :
Text Solution
|